Examples of Crypto Trend Signals for Smarter Trading

Crypto trend signals are precise technical and on-chain indicators that identify shifts in market momentum, giving traders the data they need to time entries and exits with confidence. The most cited examples of crypto trend signals include the golden cross moving average crossover, exchange net flow, cumulative volume delta (CVD) divergence, and funding rate extremes. Each of these signals operates on a different layer of market data, from blockchain activity to derivatives sentiment, and each carries specific quantitative thresholds that separate noise from genuine opportunity. Understanding how to read crypto trends means knowing which signals to combine, when to trust them, and when to wait for confirmation.
1. Examples of crypto trend signals: on-chain metrics
On-chain signals are blockchain-native data points that reveal what large market participants are actually doing, not just what price is doing. They function best as regime indicators that confirm technical analysis rather than as precise timing tools on their own.
Exchange net flow measures the difference between coins entering and leaving centralized exchanges. Exchange net flow spikes above 10,000 BTC per day typically precede price drops within one to five days as selling pressure builds. That threshold matters because it filters out routine exchange activity and flags genuine distribution events.

Long-term holder (LTH) supply tracks coins held for more than 155 days. When LTH supply drops more than 5% in a single month, Bitcoin has historically followed with a major correction. Stable or rising LTH supply, by contrast, signals quiet accumulation by the market’s most patient participants.
Spent Output Profit Ratio (SOPR) measures whether coins moving on-chain are in profit or at a loss. A SOPR reading above 1.0 means sellers are taking profit, which can cap rallies. A reading below 1.0 means sellers are capitulating at a loss, which historically marks bottoms.
Active addresses track the number of unique blockchain addresses transacting daily. Rising active addresses alongside rising price confirm genuine demand. Divergence between the two, where price rises but addresses stagnate, often signals a speculative rally without real adoption behind it.
| On-chain signal | Bullish threshold | Bearish threshold |
|---|---|---|
| Exchange net flow | Consistent negative flow for 7+ days | Positive spike above 10k BTC/day |
| LTH supply change | Stable or rising month over month | Drop greater than 5% per month |
| SOPR | Below 1.0 (capitulation) | Sustained above 1.0 (profit taking) |
| Active addresses | Rising alongside price | Flat or falling while price rises |
Pro Tip: Never read a single on-chain metric in isolation. Combining three to five on-chain metrics boosts directional forecast accuracy from 55% to 72% over 90 days. That improvement is the entire case for layered analysis.
2. Moving average crossovers and chart patterns
Technical signals translate raw price data into recognizable structures that indicate trend direction and momentum. These are the most widely used crypto signal indicators across all experience levels.
The golden cross is the clearest example: the 50-day moving average crosses above the 200-day moving average, signaling a shift from bearish to bullish trend structure. Every golden cross during Bitcoin bull cycles has preceded upside moves of 40% to 80% within three to six months. The inverse, the death cross, carries equal weight on the downside.
The cup-and-handle pattern is a multi-week consolidation structure where price forms a rounded bottom (the cup) followed by a short pullback (the handle) before breaking out. The pattern signals that sellers have been absorbed and buyers are ready to push price to new highs. In Bitcoin’s history, confirmed cup-and-handle breakouts have preceded some of the largest trending moves in the asset’s price history.
Other patterns worth tracking include:
- Head-and-shoulders: Three peaks where the middle peak is highest, signaling trend exhaustion and a likely reversal
- Inverse head-and-shoulders: The mirror image, signaling a bottom and potential uptrend
- Ascending triangle: Flat resistance with rising support, typically resolving in a breakout to the upside
- Descending triangle: Flat support with falling resistance, typically resolving in a breakdown
Support and resistance levels amplify every pattern. A golden cross that occurs right at a major resistance level carries less weight than one that occurs after a clean break above resistance. Context determines signal quality.
Pro Tip: A golden cross loses its validity if price breaks back below the 50-day moving average before the cross completes. Always wait for the weekly candle close to confirm the signal before sizing into a position.
3. Cumulative volume delta (CVD) divergences
Cumulative volume delta is the running total of the difference between buying volume and selling volume. It measures buyer and seller aggression directly, making it one of the most diagnostic tools in cryptocurrency trend analysis.
CVD divergence occurs when price and CVD move in opposite directions. There are three types every trader should recognize:
- Bearish divergence: Price makes a higher high, but CVD makes a lower high. Sellers are absorbing buying pressure at the top, and a reversal is likely.
- Bullish divergence: Price makes a lower low, but CVD makes a higher low. Buyers are absorbing selling pressure at the bottom. This divergence signals reversals with approximately 68% probability on 15-minute BTC charts, with a three-bar lead time on average.
- Bullish hidden divergence: Price makes a lower low, but CVD makes a higher low at a key structural level. Buyer absorption at support ahead of a reversal is the defining characteristic here.
CVD also confirms breakouts. Breakouts with confirming CVD succeed 71% of the time versus 34% without confirmation. That gap is why experienced traders refuse to chase breakouts that lack volume delta support.
| Trader type | Preferred CVD timeframe | Primary use |
|---|---|---|
| Scalper | 1-minute per-bar delta | Immediate order flow direction |
| Day trader | 15-minute to 1-hour CVD | Divergence and breakout confirmation |
| Swing trader | 1-hour to 4-hour CVD | Trend regime and major reversal signals |
CVD must be read against key price levels to avoid false signals. A CVD divergence in the middle of a range carries far less weight than one occurring at a major support or resistance zone.
Pro Tip: Mixing exchange net flow data with CVD without understanding the difference between spot and derivatives volume is a fast way to misread the market. Confusing flow concepts can invert your signal interpretation entirely and lead to costly mistakes.
4. Funding rates and derivatives sentiment
Funding rates are periodic payments between long and short traders in perpetual futures markets. They are one of the most direct examples of trading indicators that reveal leverage extremes and forecast trend reversals.
When funding rates turn highly positive above 0.03% per eight-hour period, the market is overcrowded with leveraged longs. This condition typically precedes sharp liquidations and corrections of 5% to 12% within five days. The signal does not predict the exact timing, but it identifies a fragile market structure where any negative catalyst can trigger a cascade.
Deeply negative funding rates below -0.02% tell the opposite story. Short sellers are paying longs to hold their positions, which means the market is positioned for a squeeze. These conditions have historically marked local bottoms in Bitcoin and Ethereum.
Key behaviors to monitor:
- Funding rate spike with price at resistance: High-probability reversal setup. Longs are trapped and sellers have the advantage.
- Negative funding with price at support: Short squeeze setup. Sellers are overextended and buyers can force a rapid move upward.
- Funding normalization after extreme: Signals that leverage has been flushed and the next directional move has a cleaner foundation.
CVD analysis combined with order book imbalance and funding rates produces more reliable trading setups than any single metric. When CVD shows buyer absorption at support while funding rates are deeply negative, the probability of a sustained bounce increases significantly.
5. How to combine multiple crypto trend signals effectively
No single signal type provides a complete picture of market conditions. The strongest cryptocurrency trend analysis frameworks stack on-chain data, technical patterns, CVD, and derivatives sentiment into a layered decision process.
| Signal type | Strength | Limitation |
|---|---|---|
| On-chain metrics | Reveals true investor behavior | Slow to update; not precise for timing |
| Moving averages and patterns | Clear visual structure; widely followed | Lagging; prone to false signals in choppy markets |
| CVD divergence | Real-time order flow; early reversal warning | Requires volume context; can mislead without price levels |
| Funding rates | Direct leverage exposure reading | Does not indicate direction alone; needs price context |
The recommended workflow for most traders follows three steps. First, use on-chain metrics to identify the macro regime: accumulation, distribution, or neutral. Second, use technical patterns and moving averages to identify the trade structure and key levels. Third, use CVD and funding rates to time the entry and confirm the signal before committing capital.
Common pitfalls to avoid:
- Acting on a single signal without cross-confirmation from at least one other layer
- Treating on-chain metrics as timing tools rather than regime indicators
- Ignoring funding rate context when interpreting CVD divergences
- Chasing breakouts that lack CVD confirmation
Beginners benefit most from starting with exchange net flow and the golden cross, two signals with clear thresholds and well-documented historical outcomes. Experienced traders can layer in CVD divergence and funding rate analysis once they have a solid foundation in reading the simpler signals. You can explore how to integrate these layers practically through the Big Move Algo blog, which covers on-chain analytics and market regime identification on an ongoing basis.
Key takeaways
Effective cryptocurrency trend analysis requires stacking on-chain metrics, technical indicators, CVD, and funding rates into a single decision framework rather than relying on any one signal.
| Point | Details |
|---|---|
| On-chain signals set the regime | Use exchange net flow, LTH supply, and SOPR to identify accumulation or distribution before trading. |
| Golden cross confirms bull trends | A 50-day MA crossing above the 200-day MA has preceded 40% to 80% Bitcoin upside moves historically. |
| CVD divergence gives early entries | Bullish CVD divergence at key support signals reversals with roughly 68% probability on 15-minute charts. |
| Funding rates reveal leverage risk | Funding above 0.03% per 8 hours signals overcrowded longs and a high probability of a sharp correction. |
| Layered analysis outperforms single signals | Combining three to five on-chain metrics alone improves directional accuracy from 55% to 72% over 90 days. |
What I’ve learned from years of watching traders misuse signals
Most traders who struggle with crypto signals are not missing information. They are missing context. I have watched traders act on a golden cross in a bear market regime and lose badly, not because the signal was wrong in isolation, but because they ignored the on-chain data screaming distribution. The signal was technically valid. The context made it worthless.
The traders who consistently perform well treat on-chain metrics as the map and technical signals as the compass. You need both. CVD and funding rates are the real-time weather report. You would not navigate without a map or ignore a storm warning just because your compass says north.
The 2025 and 2026 market cycles have reinforced one lesson above all others: the signals that worked in 2021 still work, but the thresholds have tightened. Exchange net flow spikes that once required 15,000 BTC to matter now register at 10,000 BTC. Funding rate extremes resolve faster as liquidation engines have become more efficient. Adapting your signal thresholds to current market conditions is not optional. It is the difference between a framework that performs and one that slowly bleeds you out.
Precise risk management guided by trend signals is not a feature of good trading. It is the foundation. If you are using signals to find entries but not using them to define exits, you are only doing half the work. The Big Move Guard approach of pairing signal entries with structured exit rules is the right mental model regardless of which tools you use.
— James
How Big Move Algo puts these signals to work for you
Big Move Algo is a proprietary TradingView indicator built for traders who want clear, structured signals without the complexity of managing five separate tools at once.
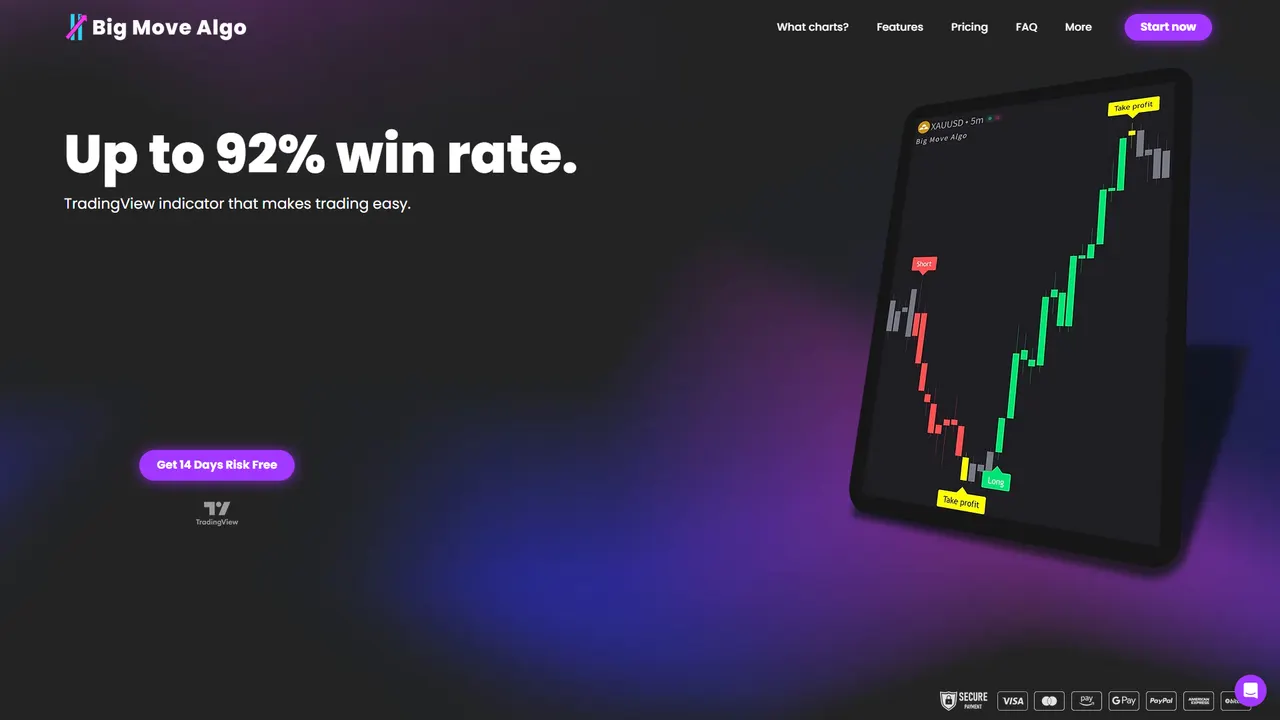
The indicator delivers Long, Short, and Exit signals in real time, drawing on multi-layer market analysis that mirrors the framework described in this article. Its built-in Fake Trend Detector filters out low-quality setups, the exact problem that trips up traders who act on unconfirmed signals. With a documented win rate of up to 92%, Big Move Algo is designed to give you the confidence of layered analysis without the hours of manual work. Check the pricing plans to find the subscription that fits your trading style and get started today.
FAQ
What are the most reliable examples of crypto trend signals?
The most reliable crypto trend signals combine on-chain data with technical indicators. Exchange net flow, the golden cross, CVD divergence, and funding rate extremes each have documented quantitative thresholds and historical track records across multiple Bitcoin market cycles.
How do I read crypto trends using moving averages?
A golden cross occurs when the 50-day moving average crosses above the 200-day moving average, signaling a bullish trend shift. This pattern has historically preceded Bitcoin upside moves of 40% to 80% within three to six months, but it requires confirmation from volume and on-chain data to be actionable.
What does cumulative volume delta tell you about crypto market trends?
CVD measures the running difference between buying and selling volume, revealing whether buyers or sellers are in control. When CVD diverges from price at a key support or resistance level, it signals a likely reversal with approximately 68% probability on 15-minute BTC charts.
When do funding rates signal a trend reversal?
Funding rates above 0.03% per eight-hour period indicate an overcrowded long market and typically precede corrections of 5% to 12% within five days. Deeply negative funding below -0.02% signals short-seller exhaustion and often marks local price bottoms.
Can beginners use on-chain signals effectively?
Yes, but beginners should start with two or three signals with clear thresholds, such as exchange net flow and LTH supply, before adding CVD or funding rate analysis. Layering complexity too quickly leads to signal confusion rather than improved decision-making.