Trade Only in Trending Markets: 5 Checks That Keep You Out of Chop

Trading only in clearly defined trending markets is a rules-based way to raise your odds without guessing where price goes next. Before you risk a dollar, check key factors: trend direction (higher highs and higher lows, or the reverse), trend strength (an ADX-style reading above a set threshold), and liquidity (steady volume so your entries and exits actually fill). Tools like Big Move Algo provide trading signals so you are not relying only on eyeballing charts under pressure.
TL;DR:
- Require higher highs and higher lows, or their inverse, a strength reading above your threshold, adequate volume, and agreement with the higher timeframe.
- Use pullback entries in orderly trends, but favor breakouts when momentum accelerates; rising volume and a retest help screen out false breaks.
- Size each position so a stop based on volatility risks a fixed percentage of account equity, and cap combined exposure across correlated trades before entry.
- Treat a fake trend warning as a reason to wait or reduce position size, especially around news events and market opens, rather than overriding it.
- U.S. stock traders who make four or more day trades in five business days in a margin account may face a $25,000 equity minimum.
Table of Contents
- Quick Checklist: When a Market Truly Qualifies as Trending
- Core Trend Trading Strategies and When to Use Each
- Indicators and Filters That Separate Real Trends From Fake Ones
- Practical Trade Setup: Timeframes, Orders, Position Sizing, and a Watchlist Routine
- Rules-Based Exits, Risk Controls, and Regulatory Checkpoints
- How to Integrate a Fake Trend Detector Effectively in Trading Decisions
- Why Systematizing Trend-Only Trading Reduces Emotional Errors
- How Big Move Algo Helps You Apply These Trend-Only Rules Faster
- FAQ
Quick Checklist: When a Market Truly Qualifies as Trending
A market earns the label “trending” only when price structure, momentum, and participation line up. Skip any one of these and you are probably staring at noise, not a trend.
Start with direction on your chosen timeframe. An uptrend shows a sequence of higher highs and higher lows; a downtrend mirrors that with lower highs and lower lows. If recent swings do not confirm that pattern, the “trend” is likely a story you are telling yourself.
Next, check strength. An ADX-style reading is a strength filter, not a trade trigger on its own. CME Group’s technical analysis course notes that technicians treat “the trend is your friend” as a working assumption, but trends are bumpy, shaped by profit-taking, other markets, and news. Strength readings help you avoid trading a flat or directionless market dressed up as a trend.
Then confirm liquidity. Average daily volume and reasonable spreads matter more than most new traders assume, since a thin market can show a clean-looking chart that is nearly impossible to trade without slippage.
- Direction: confirm higher highs and higher lows, or the inverse, over your last several swings.
- Strength: require an ADX-style reading above your chosen threshold before considering entries.
- Liquidity: check average daily volume or typical spread against your own minimum.
- Timeframe agreement: when your entry timeframe and a higher timeframe disagree, favor the higher timeframe or stand aside.
- Warning signs: choppy price action, a flattening strength reading, or inconsistent breadth across related instruments all argue for waiting.
When your entry timeframe and a higher timeframe point in different directions, the simplest fix is to wait. Cross-timeframe conflict is one of the most common reasons a “trend trade” turns into a chop trade within a day.
Core Trend Trading Strategies and When to Use Each
Once a market passes the checklist, the next decision is which entry style fits the conditions. Several approaches cover most trend-trading situations, and each has a different relationship with risk and timing.
- Buy pullbacks in an uptrend. Wait for price to retrace toward a recent swing low or a rising moving average, then enter once momentum resumes. Place your stop just below the swing low that defined the pullback, not at a round number. This style fits swing and multi-day holding periods best, since pullbacks need room to resolve.
- Short rallies in a downtrend. Mirror the pullback logic: wait for a bounce into resistance or a declining moving average, then enter short as selling pressure returns. Stops sit just above the swing high that capped the rally. The execution discipline is identical to buying pullbacks, just inverted.
- Trade breakouts with confirmation. Enter when price clears a defined level on rising volume, and consider waiting for a retest of that level before committing full size. Requiring volume confirmation and a retest cuts down on false breaks, which are common in thinner or late-session trading.
- Apply a time-trend statistical filter. A more quantitative approach fits a linear trend to recent price and only trades when that trend is statistically meaningful, trading less often as a result. Research on time-series momentum shows that this kind of sparsity, combined with efficient volatility estimators, can reduce turnover and transaction costs while keeping risk-adjusted returns similar to simpler trend rules.
Pro Tip: Match the strategy to the trend’s personality: pullback and breakout entries work well in strong, orderly trends, while a time-trend filter earns its keep in choppier conditions where fewer, higher-conviction trades beat frequent small ones.
A simple decision flow helps here. In a strong, orderly trend with clean swings, pullback or rally-short entries are usually the better fit since they offer defined risk at a known level. When momentum is accelerating and pullbacks are shallow or absent, breakout entries capture the move you would otherwise miss waiting for a retracement that never comes. When the trend looks fragile, with uneven swings or weakening strength readings, the statistical time-trend approach’s built-in selectivity keeps you out of marginal setups that pullback or breakout rules would still flag as valid.
CME Group’s trend and continuation patterns course makes a point worth remembering across all four styles: chart patterns and trends can be partly self-fulfilling because traders act on the same signals, creating herd behavior. Spotting the crowd’s direction, even without knowing the fundamental cause, helps you avoid being run over by a move you did not see building.
Indicators and Filters That Separate Real Trends From Fake Ones
Most indicator mistakes come from using a trend-strength tool as an entry trigger instead of a filter. Flip that relationship and your signal quality improves immediately.
An ADX-style reading measures how strongly a market is trending, not which direction it is going. Our related breakdown on trend strength rules and ADX guidance covers a common threshold traders use to separate tradeable trends from directionless churn. Use it to decide whether to engage at all, then rely on price structure or a moving average for direction.
Moving average alignment across multiple timeframes is a quick way to confirm direction without overthinking it. When a shorter-term average and a longer-term average are both sloping the same way, you have agreement; when they diverge, that is often the cross-timeframe conflict worth waiting out.
- Require an ADX-style reading above your threshold before treating any setup as a trend trade.
- Confirm moving average alignment across your entry timeframe and a higher timeframe.
- Check volume participation and, where relevant, breadth across correlated instruments for confirmation.
- Use a range-based volatility estimator to size stops, rather than a fixed point value that ignores current conditions.
A systematic approach built on predetermined signals can keep traders invested through favorable trends and reduce exposure once a trend reverses, limiting the emotional decisions that hurt discretionary trading, according to a profile of a systematic trend-following manager. That structure, which prioritizes rules over impulse, is the same principle behind a Fake Trend Detector: a filter layer that flags conditions where price looks directional on the surface but lacks the strength or volume to confirm it. Rather than replacing your checklist, a detector like this automates the part most traders skip when they are eager to enter: the “does this actually qualify” step.
Practical Trade Setup: Timeframes, Orders, Position Sizing, and a Watchlist Routine
Turning a trend checklist into an actual trade comes down to a set of repeatable steps.
- Pick a timeframe that matches your schedule. Intra-day trend trades on a short-term chart might last from brief periods to several hours; swing trades on a daily chart can last from several days to a few weeks. Choose one primary timeframe and stick with it rather than hopping around mid-trade.
- Select your order type by entry style. Pullback entries usually work well with limit orders at a predefined level, while breakout entries often call for a stop order placed just beyond the breakout level so you are not chasing price manually.
- Size positions by volatility, not by a flat dollar amount. Scale your position so that a stop placed at a sensible distance, often set using a range-based volatility estimate, risks a consistent percentage of your account on every trade rather than a consistent number of shares or contracts.
- Build a focused watchlist and re-scan on a set cadence. A shortlist of instruments that already pass your direction, strength, and liquidity checks is more useful than scanning hundreds of symbols; revisit the list once per session for intra-day styles, or once daily for swing styles.
- Account for extended-hours and 24/7 markets separately. Liquidity can thin out dramatically outside regular trading hours or during off-peak crypto sessions. SEC guidance on day trading points out that day traders rely on leverage and short-term price movement, which means understanding margin requirements and the real cost of trading before expenses eat into any edge.
Traders backtesting these setups before committing live capital often rely on clean historical intraday data, since look-ahead bias and gaps in free data sets can make a strategy look better on paper than it performs live. Resources like BacktestMarket’s minute-bar historical data exist specifically to close that gap for forex, indices, and commodities testing.
Rules-Based Exits, Risk Controls, and Regulatory Checkpoints
An entry rule without an exit rule is half a strategy. Decide your exit method before you enter, not after the trade starts moving against you.
Several exit methods cover most trend trades: a fixed time stop that closes the position after a set number of bars regardless of price, a volatility-based trailing stop that follows price at a distance tied to recent range, a fixed ATR-style stop set at entry, and an exit-on-opposite-signal rule that closes the trade the moment your original setup reverses. Professional systematic and CTA-style trend approaches lean heavily on this last category: CME Group’s research on trend following notes that rules-based exits are prioritized over subjective judgment about when a trend has actually reversed, specifically to manage left-tail risk, the large, fast losses that subjective exits tend to miss.
- Cap risk per trade at a fixed percentage of account equity, decided before entry, not adjusted mid-trade.
- Scale position size inversely to volatility so a wider stop in a choppier market still risks the same percentage.
- Set a maximum total exposure across open trend trades so several correlated positions cannot stack into one oversized bet.
- Test every exit rule in a demo environment across a range of past trend and non-trend conditions before using real capital.
Pro Tip: Run your exit rules through at least one strong trend, one choppy fake trend, and one sharp reversal in a demo account; if the rule only looks good in the strong trend, it is not ready.
If you are trading U.S. equities intra-day with any frequency, know the pattern day trader rule before it surprises you. SEC and FINRA guidance defines a pattern day trader as a customer who executes four or more day trades within five business days in a margin account, triggering a $25,000 minimum equity requirement at many U.S. brokerages. That threshold affects how much capital you need before intra-day trend strategies on stocks are even practical, separate from your actual trading edge.
How to Integrate a Fake Trend Detector Effectively in Trading Decisions
A Fake Trend Detector works best as a gatekeeper, not an afterthought. Check it before you evaluate entries, not after you have already decided you like the setup, since confirmation bias makes it easy to rationalize a weak trend once you are emotionally attached to a trade idea.
The practical sequence looks like this: run your direction and strength checks first, then confirm the detector shows no fake-trend warning before placing size on the trade. If the detector flags the conditions, treat that as a reason to wait or reduce size, not a detail to override because the chart “looks right.” This is especially useful around news events and session opens, when price often spikes in one direction without the volume or follow-through to sustain it.
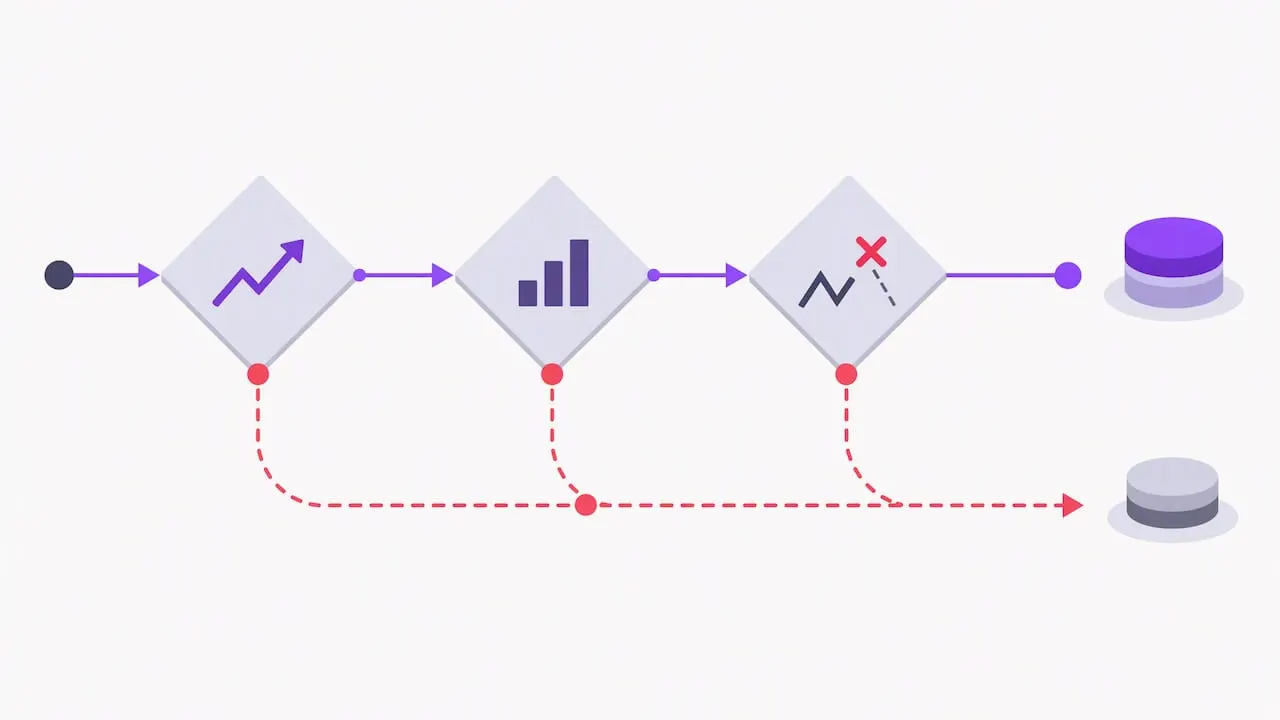
CFTC research on retail futures traders found that retail traders often act as contrarians at entry and lose money on average, with larger first-trade losses associated with leaving the market for good. A filter that catches low-quality trend conditions before entry directly addresses that pattern, since many of those losing first trades likely involve chasing a move that was never a real trend to begin with. Used consistently, a detector like this turns a judgment call you make under pressure into a yes-or-no check you make before pressure sets in.
Why Systematizing Trend-Only Trading Reduces Emotional Errors
Rules remove the moment-to-moment guesswork that causes most trading mistakes: the urge to enter early, hold too long, or skip a stop because “this time feels different.” When direction, strength, and liquidity checks are fixed in advance, automation and clear signals let you apply that discipline across more charts than you could watch manually, without drifting from the plan under stress. None of this guarantees a winning trade. Trend-only trading cuts down on noise and impulsive decisions, but it still demands testing, position sizing discipline, and the patience to sit out markets that fail the checklist.
— Steven Hartwell
How Big Move Algo Helps You Apply These Trend-Only Rules Faster
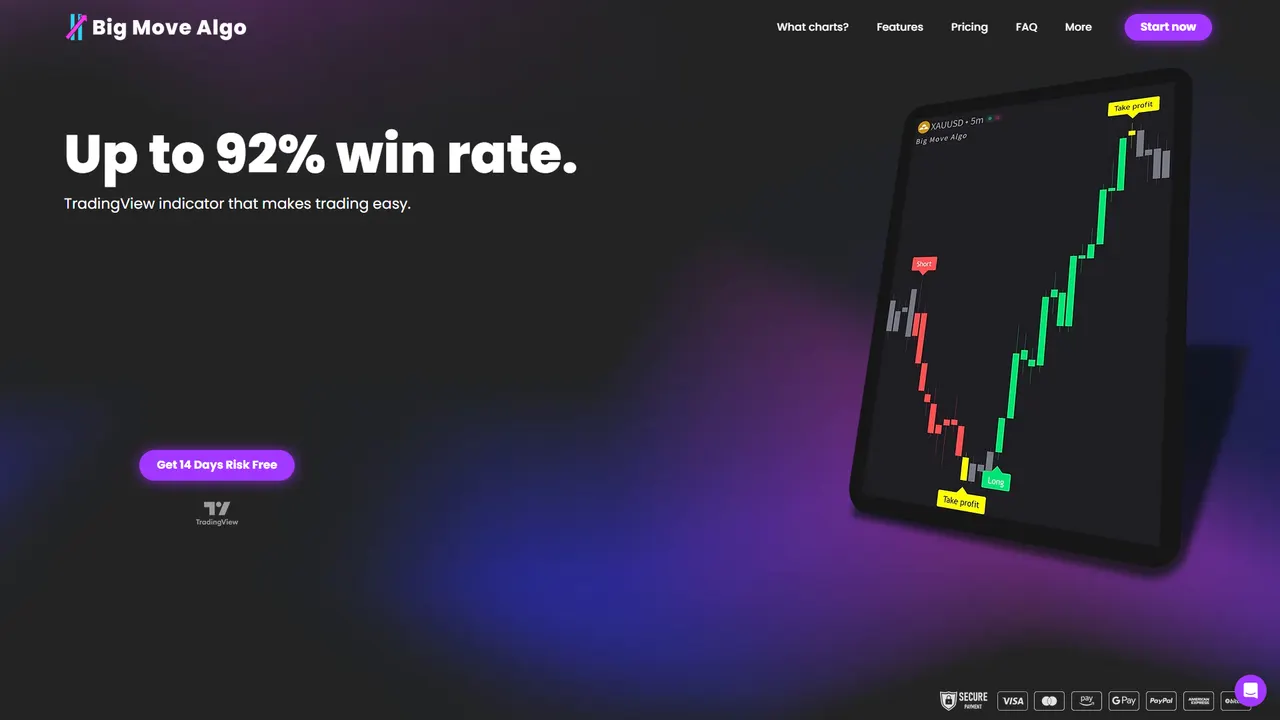
We built Big Move Algo to provide clear trading signals on a chart. AUTO Mode requires minimal setup, while Manual Mode gives experienced traders room to customize their approach. Our built-in Fake Trend Detector flags the low-quality conditions covered above, and clear Long, Short, and Exit signals replace the guesswork of deciding when a trend has actually turned. Because the indicator runs across crypto, forex, stocks, indices, and commodities, you can apply the same rules-first approach regardless of which market currently qualifies as trending.
A practical next step: load Big Move Algo onto a chart you already follow, run the checklist from this article against its signals, and backtest a handful of past trends before trading live. If you are switching from another setup, our page on how to change your TradingView account walks through getting access connected.
This article is general information, not a substitute for advice from a qualified financial advisor. Consult a qualified financial professional about your own circumstances before acting on anything here.
FAQ
How do you find trends in day trading?
Confirm trend direction on your trading timeframe using higher highs and higher lows (or the reverse), then filter with a strength reading and a liquidity check before considering entries. Cross-timeframe agreement between your entry chart and a higher timeframe reduces false signals significantly.
What’s a realistic way to think about a trader turning a small account into a large profit in minutes?
Claims about turning a small account into a large sum in a matter of minutes describe rare, high-leverage outcomes rather than a repeatable strategy, and they are not representative of typical trading results. Research on retail futures traders found that most retail participants lose money on average and that larger early losses are linked to leaving the market, which is the far more common outcome of chasing fast gains (CFTC).
What futures markets do active traders watch most for trends?
Active traders commonly watch major equity index futures, energy futures, and interest rate futures for trend-following setups, since these tend to offer the liquidity trend strategies need. CME Group’s educational materials cover trend and continuation patterns across these contract types in detail.
Which forex markets tend to trend most reliably?
Currency pairs with clear interest rate differentials or strong macro themes, often majors like EUR/USD, USD/JPY, or GBP/USD, tend to produce more persistent trends than thinly traded crosses. Liquidity and spread conditions still need to be checked individually, since even major pairs can turn choppy around low-volume sessions.
Do I need a funded account minimum to day trade trends on U.S. stocks?
Yes, under the pattern day trader rule, a customer who executes four or more day trades within five business days in a margin account is generally required to maintain at least $25,000 in equity. This requirement comes from SEC and FINRA guidance and applies at many U.S. brokerages, separate from any particular trading strategy.