TradingView Overlay Indicators: A Trader's Guide
- Steven Hartwell

- 13 minutes ago
- 8 min read

A TradingView overlay indicator is a technical tool that plots directly on the price chart, sharing the same vertical scale as price bars rather than appearing in a separate panel below. This placement is what separates overlay indicators from tools like RSI or MACD, which live in their own subpanels with independent scales. Popular examples include moving averages, Bollinger Bands, and Ichimoku Clouds. Understanding the difference between overlay and non-overlay indicator types is the foundation of building a clean, readable chart setup that actually supports faster decisions.
What is a TradingView overlay indicator?
An overlay indicator is defined by where it lives on your chart. Overlays plot on price bars, meaning every signal, line, or band they draw is measured in the same price units as the candles beneath them. A 50-period Simple Moving Average (SMA) at $150 means the average closing price over 50 bars is $150. That direct relationship to price is what makes overlays so readable at a glance.
Non-overlay indicators, by contrast, use their own scale. RSI runs from 0 to 100. MACD plots a histogram measured in momentum units. These tools answer different questions than overlays do. Overlays tell you where price is relative to a reference level. Oscillators tell you how fast or how extreme a move is. Both have value, but they serve distinct analytical roles.

The practical implication is significant. Overlay indicators share the price scale, which means you can read entry and exit levels directly from the chart without translating between two different measurement systems. That clarity reduces the mental load during live trading.
How do overlay and non-overlay indicators differ?
The clearest way to understand the distinction is to compare them side by side. The table below covers the key differences in display, scale, and typical use cases.
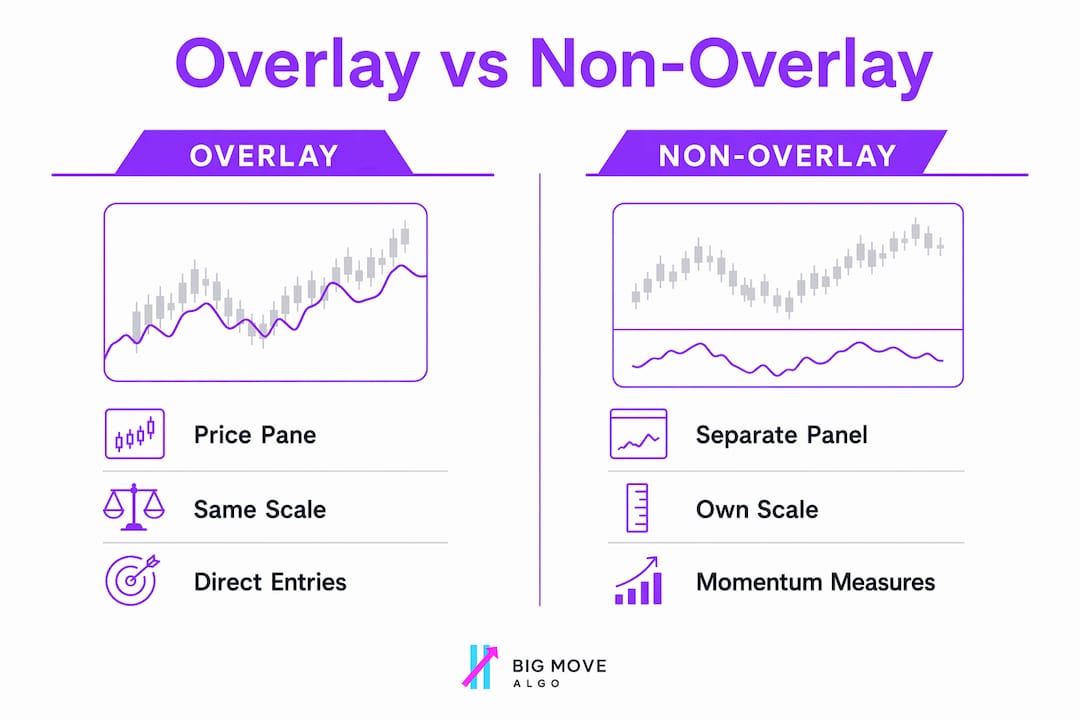
Feature | Overlay Indicators | Non-Overlay Indicators |
Chart placement | Main price pane | Separate subpanel |
Scale | Shares price scale | Independent scale |
Common examples | SMA, EMA, Bollinger Bands, Ichimoku Cloud, Parabolic SAR | RSI, MACD, Stochastic, ATR |
Primary use | Trend direction, support/resistance, price targets | Momentum, overbought/oversold, divergence |
Signal readability | Direct price reference | Requires scale interpretation |
The most common mistake traders make is treating both types as interchangeable. They are not. An EMA plotted at $200 tells you exactly where price needs to hold for a trend to remain intact. An RSI reading of 68 tells you momentum is elevated, but it gives you no price level to act on. Using conflicting indicators together without understanding this distinction is a reliable way to generate confusion rather than clarity.
Overlay indicators also interact visually with price in ways non-overlay tools cannot. When price crosses above a 200-period EMA, you see it happen on the candle itself. That visual immediacy is one reason overlays are the first tools most traders learn and the last ones they abandon.
What does the pine script “overlay” setting do?
In TradingView’s Pine Script language, every custom indicator includes a declaration at the top of the script. The overlay parameter inside that declaration controls exactly where the indicator appears on the chart. Setting overlay=true places the indicator directly on the main price pane. Setting it to false sends the indicator to a new subpanel below the chart.
Here is what a basic Pine Script declaration looks like for each case:
// Overlay indicator — plots on the price chart
indicator("My Moving Average", overlay=true)

// Separate panel indicator — plots in its own subpanel
indicator("My RSI", overlay=false)
The distinction sounds simple, but the consequences run deeper than placement. The overlay setting shapes user experience by determining how the indicator interacts with price candles, other overlaid tools, and the chart’s visual hierarchy. A script that draws support and resistance lines must use overlay=true, or those lines will appear in a disconnected subpanel with no relationship to price.
Key points to understand about the overlay parameter:
overlay=true is required for any indicator that draws lines, bands, or labels at specific price levels.
overlay=false is correct for oscillators, histograms, and any tool with its own independent scale.
Changing the overlay setting later after users have already added a script to their charts disrupts their setup and forces a re-add. Decide early.
A single Pine Script cannot behave as both an overlay and a separate panel indicator simultaneously. If you need both, you need two scripts.
Pro Tip: Before publishing any Pine Script indicator, test it on multiple chart types and timeframes with overlay=true to confirm that all drawn objects appear at the correct price levels and do not overlap with candles in a way that obscures price action.
What are the most common TradingView overlay indicators?
Moving averages, Bollinger Bands, and Ichimoku Clouds are the three most widely used overlay indicator types in technical analysis. Each serves a distinct purpose, and understanding what each one measures helps you choose the right tool for your trading style.
Moving averages: SMA and EMA
The Simple Moving Average (SMA) and Exponential Moving Average (EMA) are the foundation of overlay analysis. The SMA calculates a straight average of closing prices over a set period. The EMA weights recent prices more heavily, making it faster to respond to new price action. Traders use the 20 EMA for short-term trend direction, the 50 SMA as a medium-term trend filter, and the 200 SMA as the definitive long-term trend benchmark. A price trading above the 200 SMA is broadly considered to be in an uptrend.
Bollinger bands
Bollinger Bands plot three lines: a 20-period SMA in the center, with an upper and lower band set two standard deviations away. The bands expand during high volatility and contract during low volatility. Traders use band touches and breakouts to identify potential reversals and continuation setups. When price rides the upper band consistently, it signals a strong trend rather than an automatic sell signal, which is a distinction many beginners miss.
Ichimoku cloud
The Ichimoku Cloud is one of the most information-dense overlay indicators available. It plots five lines and a shaded cloud region that simultaneously shows trend direction, momentum, and dynamic support/resistance levels. The cloud itself acts as a visual filter: price above the cloud is bullish, price below is bearish, and price inside the cloud signals indecision. The Ichimoku system was developed by Japanese journalist Goichi Hosoda and published in 1969, making it one of the oldest comprehensive overlay systems still in active use.
Parabolic SAR
The Parabolic SAR (Stop and Reverse) plots dots above or below price candles to signal potential trend reversals. Dots below price indicate an uptrend. Dots above price indicate a downtrend. Traders commonly use Parabolic SAR as a trailing stop reference, moving their stop loss to each new dot as the trend progresses. It works best in trending markets and produces frequent false signals during sideways price action.
What advanced issues affect overlay indicator performance?
TradingView imposes resource limits on drawn objects within Pine Script indicators. When limits like max_lines_count, max_labels_count, and max_boxes_count are exceeded, TradingView silently drops the oldest drawn objects rather than throwing an error. This means your overlay can appear to stop updating or display incomplete visuals without any warning message.
This is one of the most misunderstood issues in Pine Script development. A trader sees lines disappearing from their chart and assumes the indicator has a bug. The actual cause is a resource limit being hit silently in the background. Managing these object limits carefully is the difference between a reliable overlay and one that misleads you during live trading.
Practical steps for maintaining overlay reliability:
Set max_lines_count, max_labels_count, and max_boxes_count explicitly in your indicator() declaration rather than relying on defaults.
Delete old drawn objects within your script logic when they are no longer needed to free up resources.
Test your overlay on a high-bar-count chart (such as a 1-minute chart with 5,000 bars loaded) to stress-test object limits before going live.
A single Pine Script cannot include both overlay and separate panel components. Split complex setups into two scripts: one for the price pane overlay and one for the subpanel oscillator.
Pro Tip: When building a custom overlay in Pine Script, add a visual alert or label that fires when your object count approaches the declared limit. This gives you a live warning before drawings start dropping silently.
Key takeaways
Overlay indicators are the most direct way to connect technical signals to price, and using them correctly requires understanding both their visual logic and their scripting constraints.
Point | Details |
Overlay definition | An overlay indicator plots on the main price chart, sharing the same scale as price bars. |
Overlay vs. non-overlay | Overlays give price-referenced signals; oscillators like RSI use independent scales for momentum readings. |
Pine Script control | Setting overlay=true in the indicator() declaration places the script on the price pane. |
Common overlay types | SMA, EMA, Bollinger Bands, Ichimoku Cloud, and Parabolic SAR are the most widely used overlays. |
Resource management | Exceeding max_lines_count or max_labels_count causes TradingView to silently drop drawn objects. |
Why most traders use overlays wrong
I have spent years watching traders stack five or six overlay indicators on a single chart and then wonder why their signals are contradictory. The problem is not the tools. The problem is treating overlays as a checklist rather than a system.
The most effective overlay setups I have seen use two or three indicators with clearly defined roles. One indicator defines the trend direction (a 200 EMA, for example). One defines dynamic support and resistance (Bollinger Bands or an Ichimoku Cloud). One marks entry and exit timing (Parabolic SAR or a short-period EMA crossover). Each tool answers a specific question. None of them overlap in purpose.
The other mistake I see constantly is mixing overlay signals with oscillator signals without a clear hierarchy. When your 50 EMA says the trend is up and your RSI says overbought, which one wins? If you do not have a rule for that conflict before you enter the trade, you will make the decision emotionally in the moment. That is where losses come from. Conflicting indicators cost traders real money, not because the indicators are wrong, but because the trader has no framework for resolving disagreements between them.
My honest recommendation: start with one overlay indicator and learn exactly how price behaves around it across 100 trades before adding anything else. Depth of understanding beats breadth of tools every time.
— Steven Hartwell
How big move algo puts overlay signals to work
If you want overlay-based signals without building your own Pine Script setup from scratch, Big Move Algo delivers exactly that. Big Move Algo is a proprietary TradingView indicator that plots Long, Short, and Exit signals directly on your price chart, keeping every signal in the same visual context as price action. No subpanel hunting. No scale translation.
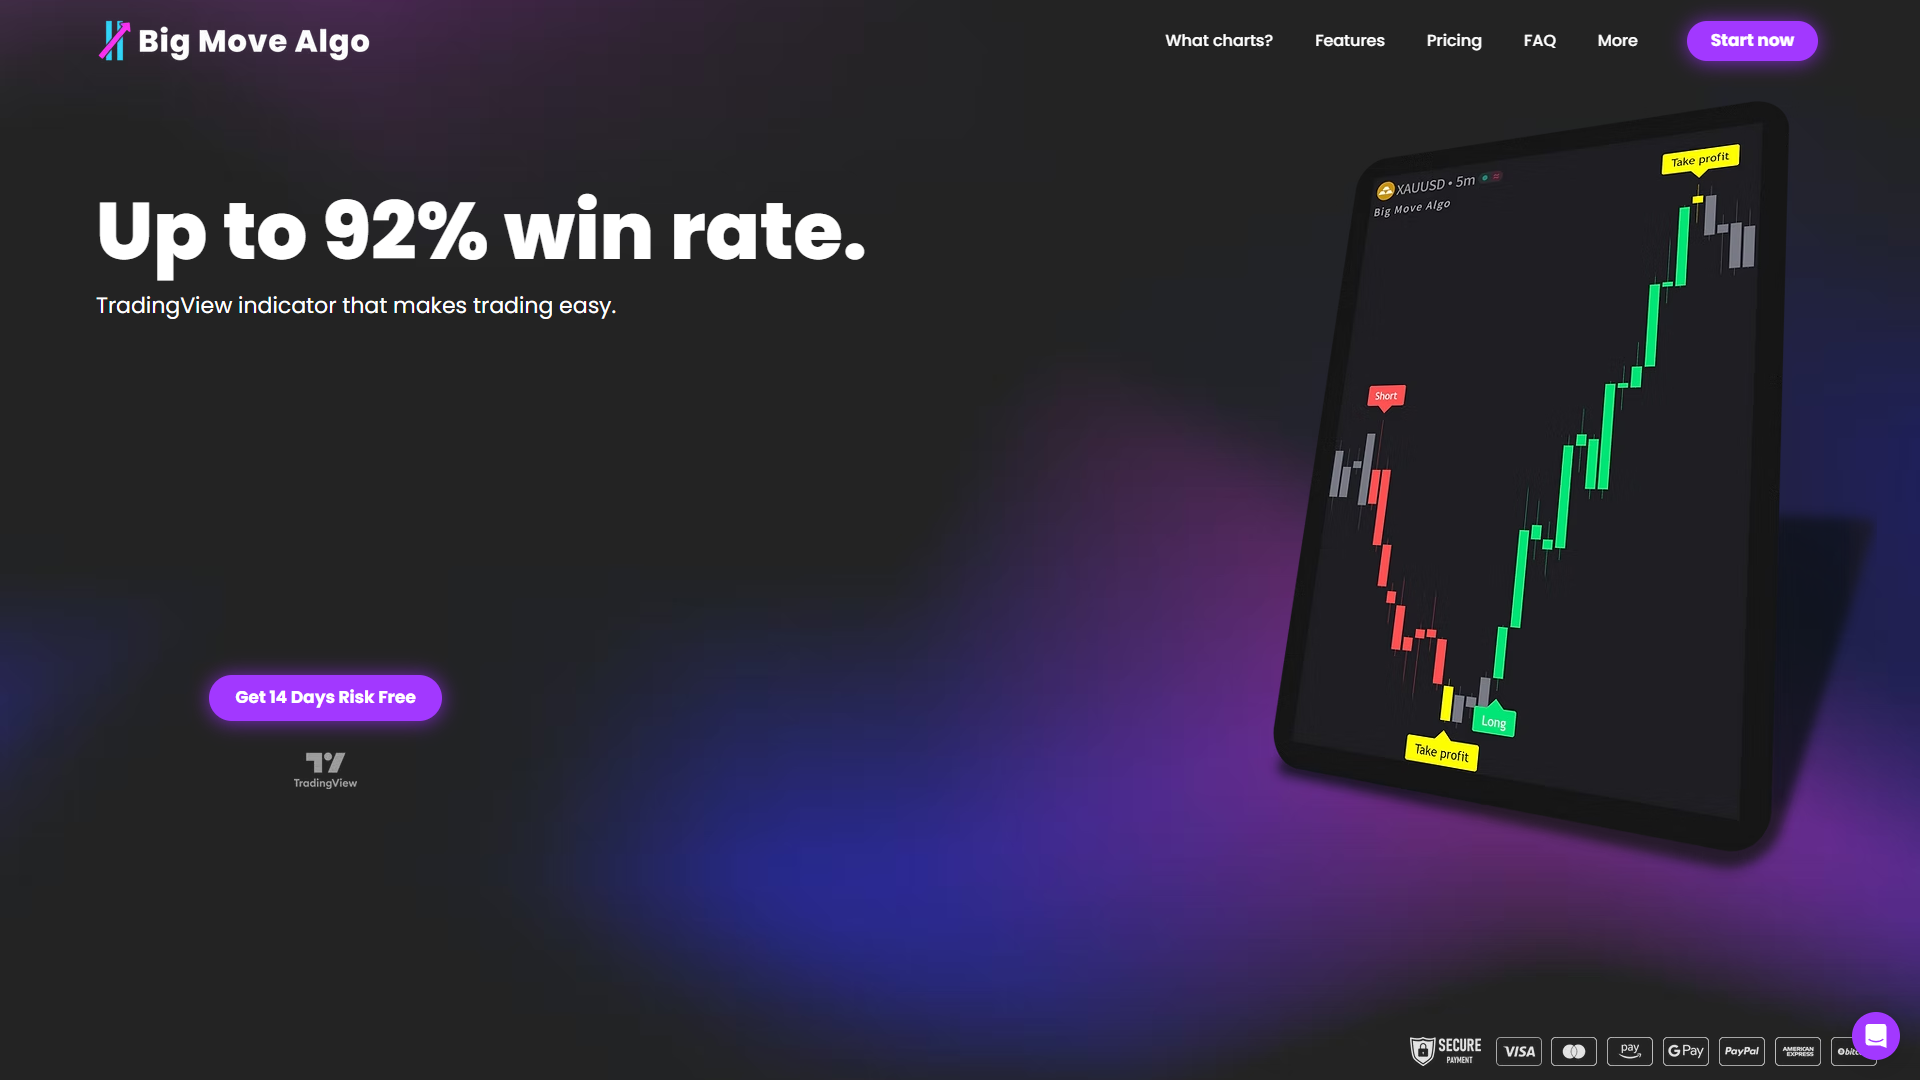
The built-in Fake Trend Detector filters out low-quality market conditions before a signal fires, which addresses the core weakness of most overlay systems: false signals during choppy, sideways price action. Big Move Algo works across crypto, forex, stocks, indices, and commodities. AUTO Mode gets you running with minimal setup, while Manual Mode gives experienced traders additional control. See how it works and decide if it fits your trading style.
FAQ
What is a TradingView overlay indicator?
A TradingView overlay indicator is a technical tool that plots directly on the main price chart, sharing the same vertical scale as price bars. Common examples include moving averages, Bollinger Bands, and Ichimoku Clouds.
How does an overlay indicator differ from RSI or MACD?
RSI and MACD are non-overlay indicators that appear in separate subpanels with their own independent scales. Overlay indicators plot on the price chart itself, making their signals directly readable in price terms.
What does overlay=true mean in pine script?
Setting overlay=true in a Pine Script indicator() declaration places the indicator on the main price chart pane rather than in a separate panel below. This setting must be decided before publishing because changing it later disrupts existing user setups.
Can one pine script be both an overlay and a separate panel indicator?
No. A single Pine Script cannot function as both an overlay and a separate panel indicator simultaneously. Traders who need both must use two separate scripts.
Why do lines disappear from my TradingView overlay indicator?
TradingView silently drops the oldest drawn objects when resource limits like max_lines_count or max_labels_count are exceeded. Setting these limits explicitly in your script and deleting unused objects prevents this issue.
Recommended
Comments