Fix Backtest Pitfalls Fast: A 9 Step Checklist to Protect Live Trades

Most attractive backtests fail live because of four avoidable errors: overfitting, biased data, unrealistic execution, and weak validation. These four categories explain the overwhelming majority of strategies that look profitable on paper and then lose money once real orders hit real markets. The fixes are concrete, and the checklist below walks through each one along with the forward-testing steps that confirm whether a strategy actually holds up.
TL;DR:
- Log every parameter combination and state your hypothesis before testing; repeated tuning contaminates holdout data, so prefer simpler rules with an economic rationale.
- Use point in time data that includes delisted assets and dated corporate actions, and check timestamps and sampling intervals across every source.
- Model actual commissions, historical spreads, slippage scaled to liquidity, latency, and partial fills; intraday or order flow strategies may require tick or order book replay.
- Validate with walk forward windows, Monte Carlo tests, and performance checks across market regimes, then use paper trading or shadow execution before risking capital.
Table of Contents
- Why backtests can deceive you
- Statistical pitfalls: overfitting, multiple testing, and why naive hold-out fails
- Look-ahead and survivorship bias: preventing leaked future info
- Data quality and sampling: ticks vs bars, timestamps, and coverage
- Execution realism: modeling commissions, spreads, slippage, and latency
- Order simulation pitfalls: fills, order types, and venue realism
- Validation approaches: walk-forward, Monte Carlo, and forward testing
- Metrics and interpretation: reading backtest numbers conservatively
- Practical checklist: nine steps to reduce common backtest pitfalls
- How we approach these pitfalls at Big Move Algo
- A lesson from watching strategies fail after looking great on paper
- Put the checklist to work with Big Move Algo
- FAQ
- Sources
Why backtests can deceive you
A backtest is not a record of what happened. It is a reconstruction built from historical data, a set of rules, and a string of modeling choices, any one of which can quietly bend the result toward optimism.
Researchers call this the “alternative past” problem: a backtest shows you one version of history filtered through your assumptions, not the one objective truth. When you test many rule variations and keep only the best performer, you run into what statisticians call the winner’s curse. The best result among a hundred random variants will look great even if none of them has real predictive power.
A few patterns show up constantly in strategies that fail after launch:
- A backtest with many tested parameter combinations but no record of how many failed.
- Historical price or fundamental data that silently includes information unavailable at the time.
- Fills assumed at the exact signal price with zero cost or delay.
- A single in-sample and out-of-sample split treated as sufficient proof.
The rest of this guide breaks down where each of these problems originates and how to harden your process against them before you risk real capital.
Statistical pitfalls: overfitting, multiple testing, and why naive hold-out fails
Overfitting happens when a strategy’s rules are tuned so closely to historical noise that they stop reflecting any real market behavior. The more parameter combinations you test, the higher the odds that one of them matches past data purely by chance.
This is a math problem as much as a trading one. Academic work on statistical overfitting in backtests shows that even a number of trials against a limited sample length can produce an in-sample Sharpe ratio that looks excellent and still carries no out-of-sample edge. The same research warns that rising model complexity without a clear economic rationale raises the risk of overfitting further, which is why simpler, interpretable rules are usually safer defaults.
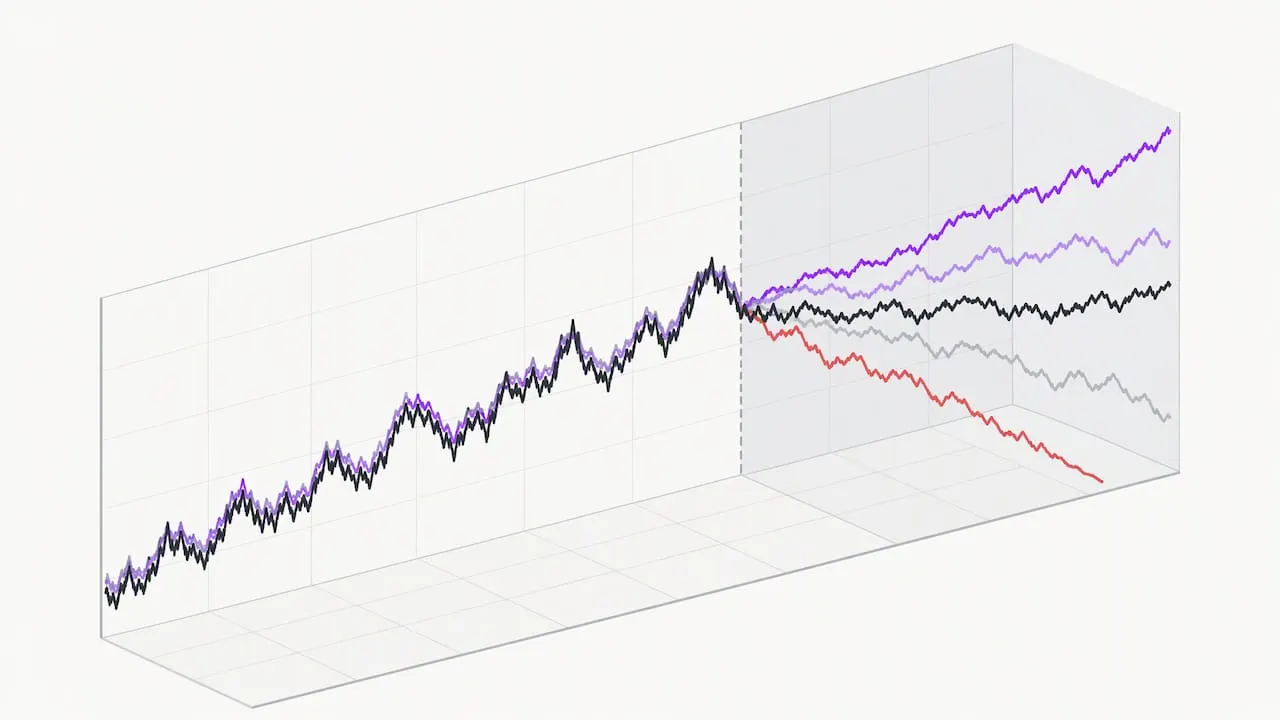
A naive hold-out split does not solve this either. If you tweak your rules after looking at the out-of-sample segment, that segment has effectively become part of your in-sample testing, and the contamination defeats the entire purpose of the split.
Practical mitigations:
- Log every parameter combination you test, not only the ones that worked.
- Write down your hypothesis before you run the first test, not after seeing a result you like.
- Favor fewer parameters and simpler logic over sprawling optimization grids.
- Where you have enough trials recorded, apply a deflated or probabilistic Sharpe ratio adjustment to correct for the number of attempts.
Our guide to avoiding overfitting in trading backtests walks through experiment logging and parameter discipline in more detail.
Look-ahead and survivorship bias: preventing leaked future info
Look-ahead bias means a backtest uses information that was not actually available at the moment a trade decision would have been made. A common version: testing a strategy against today’s list of index constituents as if that list applied years ago, when in reality many of those companies were not yet included, or others that have since been delisted were.
Another frequent case involves fundamentals data. End-of-day financial figures are often restated or finalized after the fact, so feeding them into an intraday backtest as if they were known in real time overstates performance in a way that will not repeat live.
CFA Institute guidance on backtesting and simulation names look-ahead bias as one of the most common and damaging mistakes in this discipline, alongside survivorship bias from filtered universes that quietly drop failed assets.
The fix is point-in-time data: a dataset that reflects exactly what was knowable and tradable on each historical date, including delisted stocks, expired contracts, and corporate actions tagged to the date they actually occurred. Practitioner notes on common backtesting problems reinforce that point-in-time constituent lists are required to avoid survivorship bias rather than optional.
Run the same backtest twice, once with a point-in-time dataset and once with a current snapshot, and compare the gap. If the current-snapshot version performs meaningfully better, bias is likely inflating your results. Our one-bar tests for catching look-ahead bias post walks through a quick method for spotting leaked information before it corrupts a full backtest.
Data quality and sampling: ticks vs bars, timestamps, and coverage
Clean logic running on dirty data still produces a dirty result. The most common data problems are mundane but costly: missing ticks during low-liquidity periods, timestamps recorded in the wrong time zone, and corporate actions like splits or dividends applied on the wrong date.
Bar data, where each candle summarizes open, high, low, and close over a fixed interval, works fine for strategies that trade on daily or multi-hour signals. It breaks down for intraday or order-flow strategies that depend on the sequence of individual trades within a bar, since a single bar can hide a price spike and reversal that a bar-based backtest never sees.
Before trusting a backtest’s output, check three things:
- Confirm timestamps are normalized to one consistent time zone across every data source used.
- Resample data consistently, so a strategy tested on 5-minute bars isn’t accidentally fed 1-minute data in one segment.
- Verify data provenance against the exchange itself when numbers look unusually clean or unusually volatile.
Strategies that depend on fine-grained execution timing need tick or order-book replay data rather than bars. Skipping this step is one of the quieter ways a backtest misrepresents what a live account would experience.
Execution realism: modeling commissions, spreads, slippage, and latency
Ignoring trading costs is one of the fastest ways to turn a losing strategy into a backtested winner. Research on backtesting protocols from Duke University found that the statistical significance of many published market anomalies disappears once realistic transaction costs are applied, and that failing to include commissions, slippage, and bid-ask spreads is a primary reason backtested strategies turn unprofitable in live trading.
A profitable-looking strategy with a tight average win can be erased entirely by costs that were never modeled. Four components matter:
- Commissions, which vary by broker and instrument and should be pulled from your actual fee schedule rather than assumed as zero.
- Bid-ask spread, which widens during volatile or illiquid periods and should be sampled from real historical spreads, not a fixed estimate.
- Market impact, relevant for larger position sizes that can move the price against you as you enter.
- Slippage, which should scale with liquidity and time of day rather than sit at one flat number across every trade.
A practical way to ground these numbers is to pull your own trade history and measure actual costs rather than guessing. Our post on calculating spread and commission costs from your last 50 trades walks through that process. For slippage specifically, our guide to cutting bad fills covers priority fixes retail traders tend to overlook.
Latency between signal generation and order placement matters too, especially for fast-moving markets. A backtest that assumes instant execution at the signal price is modeling a trade that cannot happen in practice.
Order simulation pitfalls: fills, order types, and venue realism
Most basic backtests assume a market order fills instantly at the exact price shown on the chart. Real execution rarely works that way. Limit orders may never fill if price moves through the level without trading there. Immediate-or-cancel orders can fail entirely during fast markets. Even market orders can fill at a worse price than the one displayed if liquidity at that moment is thin.
Partial fills are another overlooked detail. A large order in a shallow market may fill in pieces at progressively worse prices rather than all at once, and a backtest that assumes one clean fill overstates performance for any strategy trading meaningful size relative to available liquidity.
A few adjustments improve fidelity without requiring full order-book infrastructure:
- Model fill probability by liquidity bucket rather than assuming every order fills.
- Add a rejection probability for limit orders placed far from the current price.
- Separate your assumptions for market orders versus limit orders instead of using one fill model for both.
High-frequency or intraday strategies that depend on fine execution timing generally need order-book replay data or venue-specific historical records rather than simplified bar-based fills. Our guide to TradingView’s strategy tester covers where its default fill assumptions fall short and how to work around them.
Validation approaches: walk-forward, Monte Carlo, and forward testing
A single in-sample and out-of-sample split tells you how a strategy performed on one historical period. It does not tell you how stable that performance is across time, which is the question that actually matters before risking money.
CFA Institute guidance recommends walk-forward and rolling-window methodologies as standard practice because they better approximate how a strategy would actually be updated and retrained over time, rather than relying on one static hold-out period that may or may not represent future conditions. The same guidance notes that returns often show skewness and heavier tails than a normal distribution assumes, so scenario and sensitivity analysis should reflect that rather than relying on simplified statistical models.
Monte Carlo simulation and resampling techniques test how sensitive your results are to the specific sequence of trades and to small changes in parameters, which helps separate a genuinely robust strategy from one that happened to catch a lucky sequence of events. Running the same strategy across distinct market regimes, trending, ranging, high volatility, low volatility, shows whether performance depends on one narrow environment.
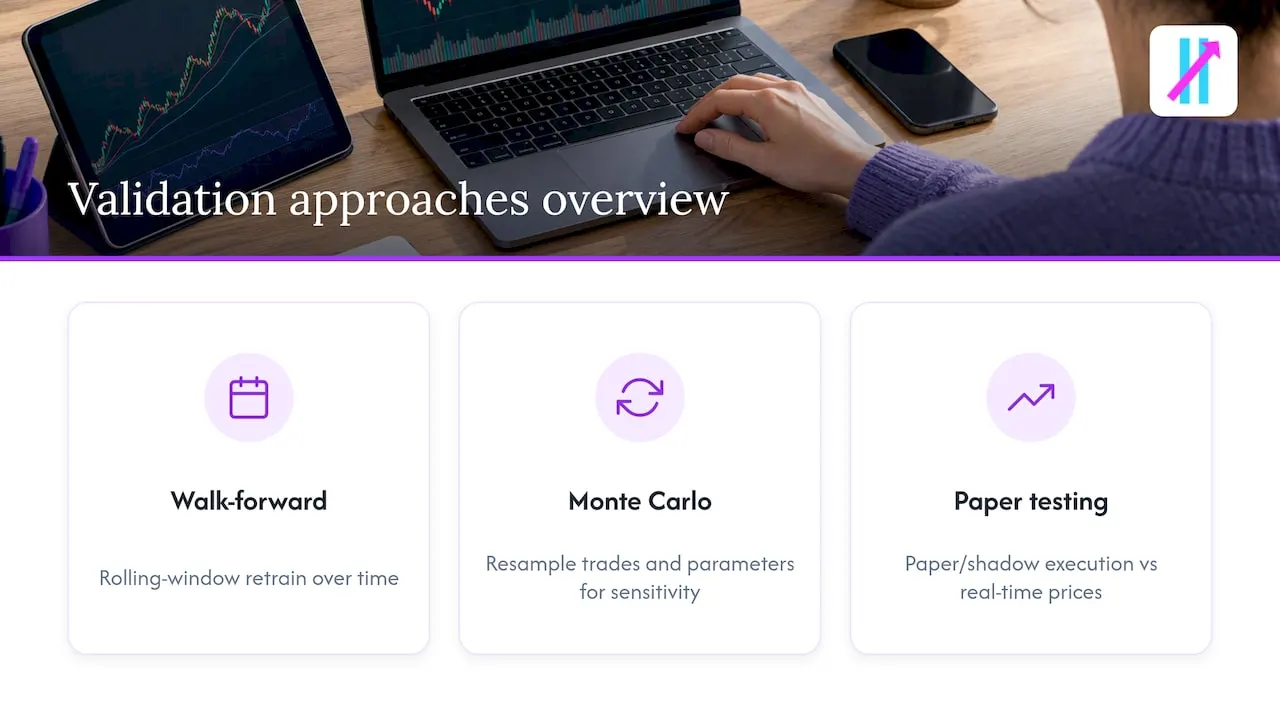
Even the best historical validation cannot fully replace live conditions. Paper trading and shadow execution, where you track hypothetical fills against real-time prices, function as the closest approximation of true out-of-sample testing available before committing capital. Our forward testing guide for TradingView users breaks this process into concrete steps.
Metrics and interpretation: reading backtest numbers conservatively
A raw Sharpe ratio or CAGR number means very little without context about how it was produced. A strategy tested across dozens of parameter combinations and reported with its single best Sharpe ratio is not describing the strategy’s real expected performance, it is describing the best outcome from a biased search.
Deflated and probabilistic Sharpe ratio adjustments exist specifically to correct for this, factoring in sample length and the number of trials run before a result was selected. Treat these adjusted figures as more trustworthy than the raw number whenever both are available.
Beyond the headline statistic, look at the full shape of returns:
- Drawdown depth and duration, not just the maximum value.
- Skewness and kurtosis, since a strategy with frequent small wins and rare catastrophic losses can look stable until it isn’t.
- Tail-risk behavior under stressed or low-liquidity conditions.
A practical rule worth holding onto: require a strategy to show economic significance, meaning a logical reason the edge should exist, along with stability across multiple market regimes, rather than accepting one impressively high Sharpe ratio as sufficient proof on its own.
Practical checklist: nine steps to reduce common backtest pitfalls
Working through these steps in order catches most of the failures covered above before a strategy ever touches live capital.
- Log every experiment and the total number of trials run, including the ones that failed.
- Use point-in-time data that includes delisted instruments and expired contracts.
- Model transaction costs and spreads using your own historical trade data.
- Simulate realistic fills, partial fills, and latency between signal and execution.
- Limit parameter sweeps and regularize toward simpler, interpretable models.
- Run walk-forward testing and Monte Carlo stress tests on the results.
- Check performance stability across multiple market regimes.
- Forward test with paper trading or shadow execution before going live.
- Size positions conservatively and monitor live performance against backtested expectations.
Pro Tip: When a strategy’s edge is hard to explain in plain language, simplify the model rather than adding another filter to prop it up.
How we approach these pitfalls at Big Move Algo
We write regularly about the exact failure points covered above, including our breakdowns of look-ahead bias testing and overfitting reduction techniques, because we think traders should understand the limitations of any tool before relying on it.
Our indicator is built around that same philosophy of conservative signal generation. The Fake Trend Detector is designed to filter out low-quality market conditions rather than force a signal in every environment, and AUTO Mode keeps setup minimal so newer traders aren’t tempted into excessive parameter tweaking that leads to overfitting. Manual Mode gives experienced traders more control while keeping the signal logic structured rather than open-ended.
Running on TradingView, the indicator works across multiple asset classes. We built it as a decision-support layer, not a replacement for the validation checklist above. Pairing any signal tool with point-in-time data, realistic cost modeling, and forward testing is what actually determines whether it holds up in live markets.
A lesson from watching strategies fail after looking great on paper
The most common trap isn’t a bad idea. It’s a good idea tested too many times until one version happened to match the noise in the data. Traders rarely fail because their logic was wrong; they fail because they kept adjusting until the backtest agreed with them, then stopped checking.
The fix isn’t a smarter indicator. It’s slower validation: fewer parameter tweaks, honest accounting of every failed test, and a forward-testing period long enough to let reality disagree with you before your capital is on the line. Treat a great backtest as a hypothesis worth testing further, not a conclusion worth trading on.
Traders backtesting on thinner markets face an extra layer of this problem, since low liquidity amplifies every modeling shortcut. The backtesting framework from Assymetrix covers execution-aware simulation specifically for that kind of environment.
— Steven Hartwell
Put the checklist to work with Big Move Algo
Working through nine checklist items by hand for every strategy idea is slow, and most traders abandon the discipline halfway through. We built the indicator to take the guesswork out of signal generation itself, so your energy goes toward validating a strategy properly instead of staring at charts trying to spot a setup.
The indicator delivers clear Long, Short, and Exit signals directly on TradingView, with the Fake Trend Detector filtering out conditions where a trade likely isn’t worth taking. AUTO Mode gets you running in minutes, and Manual Mode adds room to customize once you know what you’re looking for. None of that replaces the validation steps above. Run any signal through forward testing and realistic cost modeling before trusting it with real size. If you want to see how the indicator fits into your own process, visit Big Move Algo to check current plans and get instant access.
FAQ
What are the limitations of backtesting?
Backtesting shows how a strategy would have performed on historical data, but it cannot account for future conditions, structural market changes, or execution realities that differ from the model used. Even a carefully built backtest with point-in-time data and realistic costs remains a hypothesis that still needs forward testing before it’s trusted with live capital.
What is the 3-5-7 rule in trading?
It’s a position-sizing heuristic rather than a backtesting methodology, and traders should validate any sizing rule against their own strategy’s drawdown profile.
What are the three main types of backtests?
Backtests are generally grouped into simple historical simulation (a single in-sample and out-of-sample split), walk-forward testing (rolling windows that better approximate live updating), and Monte Carlo or resampling-based testing (which checks sensitivity to trade sequence and parameter variation). CFA Institute guidance recommends combining walk-forward and scenario-based approaches rather than relying on one method alone.
Can ChatGPT backtest a trading strategy?
A general-purpose language model can help write backtesting code, explain statistical concepts, or review logic for obvious errors, but it cannot execute a real backtest against point-in-time market data on its own. Traders still need a dedicated backtesting platform or coding environment connected to verified historical data to produce trustworthy results.
Sources
- A Backtesting Protocol in the Era of Machine Learning (Duke / Charvey et al.)
- Backtesting & Simulation | CFA Institute
- Statistical overfitting and backtest performance (Bailey et al.)