Best Day Trading Indicators: What to Use and When

The best day trading indicators are the ones that answer three questions without crowding your chart: which way is price leaning, is there momentum behind it, and how far should you let it run before you are wrong. VWAP, moving averages, MACD, RSI, volume and ATR each cover one of those jobs. If you would rather have the trend, momentum and noise filtering done in a single TradingView tool that prints Long, Short and Exit signals, Big Move Algo is built for exactly that.
Below you will find each classic indicator compared on what it measures and how to read it, where Big Move Algo fits, the chart timeframes that suit day trading and swing trading, and a simple way to combine tools without drowning in signals.
TL;DR
- Pick one tool per job: trend (moving averages or VWAP), momentum (MACD or RSI), and volume for confirmation. Stacking five tools that say the same thing adds clutter, not confidence.
- VWAP is the most widely used intraday reference, because it shows where the day’s volume-weighted average price sits.
- The 5-minute chart is the usual starting point for US stock day trading. Use a higher timeframe for bias and a lower one for the entry.
- Big Move Algo puts Long, Short and Exit signals, AUTO and Manual modes and a Fake Trend Detector into one TradingView indicator.
- Size every trade from the stop, not the other way around. ATR makes that stop objective.
Table of Contents
- What an indicator actually does for a day trader
- The classic indicators compared
- Where Big Move Algo fits next to the classics
- Best timeframes for day trading
- Best timeframe for swing trading
- How to combine indicators without overload
- Risk: set the stop before the size
- Our perspective
- Get started with Big Move Algo
- FAQ
- Sources
What an indicator actually does for a day trader
A technical indicator is a calculation based on past price or volume, drawn on the chart so you can read it faster than raw candles. Fidelity’s primer on indicators groups them into trend tools (moving averages, MACD, ADX), momentum tools (stochastic, RSI), volume tools (OBV, money flow), volatility tools (Bollinger Bands, ATR) and support and resistance tools such as Fibonacci retracements.
That grouping is the key to choosing. If you run RSI and the stochastic together, you are looking at two momentum readings. If you run a 20 EMA and a 20 SMA, you are looking at two trend readings. A clean setup takes one from each family.
For day trading, speed matters as well. Above the Green Line notes that day trading happens on 1-, 5- and 15-minute charts, and that slow tools built for position trading, such as the 50-day moving average or weekly RSI, are too slow intraday.
The classic indicators compared
| Indicator | Family | What it tells you | Common intraday setting |
|---|---|---|---|
| VWAP | Volume / trend | Average price weighted by volume since the open | Resets each session |
| Moving averages (EMA/SMA) | Trend | Direction and crossovers | 9 and 20 EMA, or 10, 20, 50 bars |
| MACD | Trend / momentum | Momentum shifts via line and signal crossovers | 12, 26, 9 |
| RSI | Momentum | Overbought or oversold pressure | 14 periods, 70/30 |
| Bollinger Bands | Volatility | Stretch from the average | 20-period, 2 standard deviations |
| Volume / RVOL | Volume | Participation behind a move | Compare to normal volume |
| ATR | Volatility | Typical range, used for stops | 14 periods |
| Big Move Algo | All-in-one signal | Long, Short and Exit signals with a trend-quality filter | AUTO or Manual Mode |
The settings above come from QuantVPS’s indicator guide and CenterPoint Securities. They are starting points, not magic numbers.
Big Move Algo: the pick for traders who want signals, not a toolbox
Big Move Algo is a proprietary TradingView indicator that analyzes the market in real time and prints Long, Short and Exit signals. Most traders reading this are not short of indicators. They are short of a clear decision, and that is the gap it is designed to close.
Three things set it apart on a day trading chart:
- AUTO Mode and Manual Mode. AUTO needs minimal setup, so you can be trading the same session. Manual Mode gives experienced traders more customization.
- Fake Trend Detector. It is built in to help filter out low-quality or misleading market conditions where trading may not be recommended. That targets the most common day trading problem: taking a trade in chop.
- No repainting. The signals are designed not to redraw after the fact, so what you see on the chart is what you would have acted on.
It works across crypto, forex, stocks, indices and commodities, runs on unlimited devices, sends alerts to multiple platforms, and can be connected to automated trading platforms. Updates are free. If you trade several markets, one signal language across all of them is easier to learn than a different toolkit per asset.
VWAP: the intraday reference point
VWAP is the average price of the day weighted by volume. CenterPoint Securities calls it perhaps the single most widely used day trading indicator. Institutions use it to execute without moving the market, so price tends to drift back toward it, and it acts as intraday support and resistance.
A practical read: price holding above VWAP favors longs, price below favors shorts, and a reclaim of VWAP after a flush is a common area to look for entries. Because it resets every session, it is a day trading tool and not a swing tool.
Moving averages: trend in one line
A simple moving average weights every bar equally, while an exponential moving average weights recent bars more, so it reacts faster in volatile conditions. CenterPoint lists 10, 20, 50 and 200-bar look-backs as the usual choices. Above the Green Line favors the 9 and 20 EMAs for short-term trend.
The reading is easy: price above a rising average is an uptrend, and a short average crossing a longer one is read as a bullish or bearish shift. The 9 and 20 EMA pair is a good fit for the 5-minute chart.
MACD: momentum with a built-in trigger
MACD subtracts a 26-period EMA from a 12-period EMA and compares the result to a 9-period signal line. Per Fidelity’s entry and exit guide, a MACD cross above the zero line is bullish and below it bearish, and signal-line crosses further from the zero line carry more weight. Use it to confirm that momentum agrees with your trend tool.
RSI: reading pressure, not calling tops
RSI runs from 0 to 100, with readings above 70 traditionally overbought and below 30 oversold. CenterPoint points out that a strongly moving asset can stay at an extreme for a long time, so treat RSI as a context reading, not a standalone trigger. Fidelity adds a useful refinement: in bull markets RSI tends to hold between roughly 40 and 90, with 40 to 50 acting as support, so a dip to 40 in an uptrend is more interesting than a dip to 30.
Volume and relative volume
Volume tells you whether a move has participation. Fidelity’s rules: rising volume reinforces the trend direction, falling volume weakens it, and a high-volume peak or trough is often an important turning point. Relative volume (RVOL) compares today’s volume with normal, which helps you separate unusual setups from ordinary noise.
Bollinger Bands and ATR: volatility
Bollinger Bands wrap a 20-period average with bands two standard deviations away, showing when price is stretched. A touch of the band is information, not an automatic reversal signal.
ATR measures typical range and is the most useful tool on this list for stops, which the risk section below covers.
Where Big Move Algo fits next to the classics
The classics each answer one question. You then have to combine the answers yourself, in real time, under pressure. That is where emotional decisions creep in: you see RSI at 28, price under VWAP and a MACD about to cross, and you talk yourself into either side.
Big Move Algo turns that stack into one structured output: Long, Short or Exit. The Fake Trend Detector is aimed at the situations where the classics tend to disagree, which is sideways, low-quality conditions. A trader who is overwhelmed by settings can start in AUTO Mode and keep the chart to price, the signal and a volume reading.
If you want to see how signals translate to an actual routine, our guide to day trading signals in real time walks through it, and the volatility filter article explains why cutting trades in poor conditions matters as much as finding good ones.
Best timeframes for day trading
Indicators behave differently on different charts, so choose the timeframe before you choose the settings.
The 5-minute chart is the default. Curved’s 2026 beginner timeframe guide calls it the institutional default for US equity day trading, with about 78 bars in the 9:30 a.m. to 4:00 p.m. ET session. TraderNest agrees, putting it at roughly 78 candles and 3 to 8 quality setups a day.
The 1-minute chart is for scalpers. About 390 candles a session, mostly noise. Curved warns it generates whipsaws for beginners.
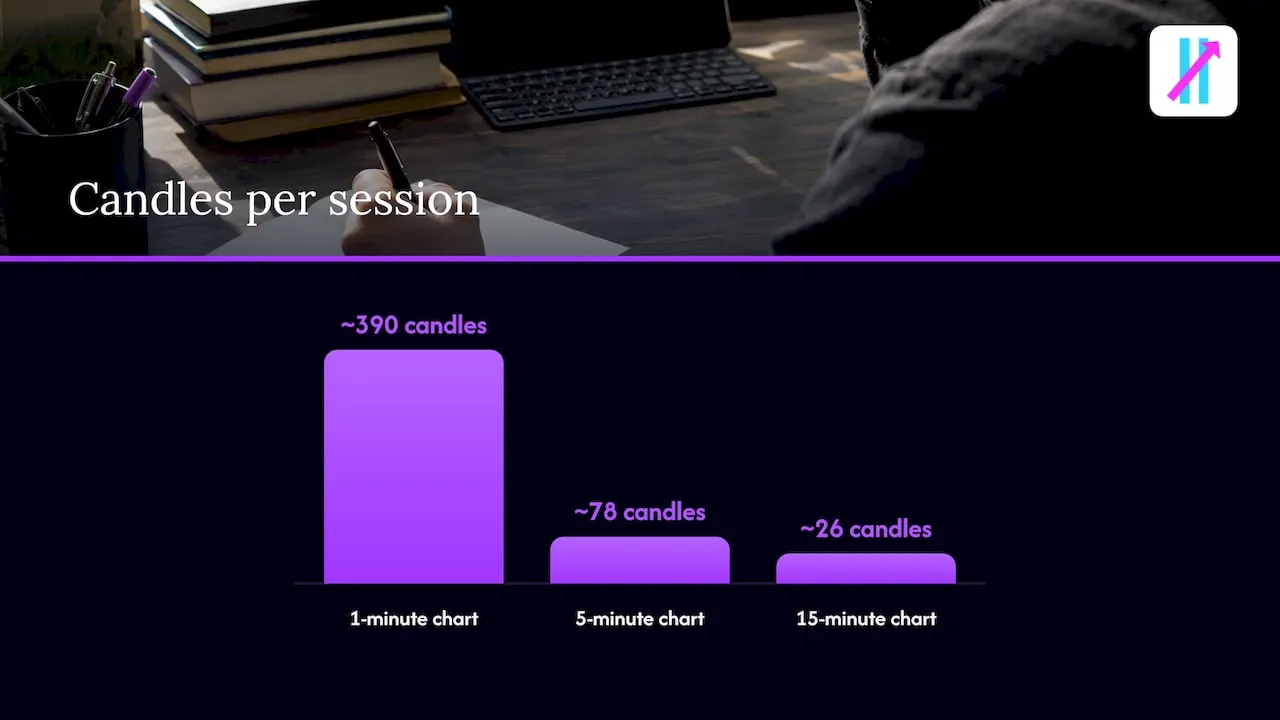
The 15-minute chart suits part-time traders. About 26 candles a session, so fewer decisions. Trade That Swing matches 10 and 15-minute charts to traders who take one or two trades a day.
Stack two timeframes. The best entries come from agreement between charts. A common stack is a 1-hour chart for bias, a 5-minute chart for the setup and, optionally, the 1-minute chart for the trigger. A simpler version for beginners: read the trend on the 15-minute chart and enter on the 5-minute.
| Style | Bias chart | Entry chart |
|---|---|---|
| Scalping | 5-minute | 1-minute |
| Day trading | 1-hour or 15-minute | 5-minute |
| Part-time day trading | 1-hour | 15-minute |
Best timeframe for swing trading
Swing trading holds positions for days, so the charts move up. Pomegra’s guide names the daily and 4-hour pair as the ideal combination for stocks: the daily chart defines the dominant trend and the 4-hour chart finds entries. Trade That Swing, by contrast, uses the daily chart alone for stock swing trades and drops to a short intraday chart only to refine entries.
The practical difference: VWAP resets daily and belongs to day trading, while swing traders lean on moving averages, MACD and ATR on the daily chart. Big Move Algo works across timeframes on TradingView, so you can keep one signal framework whether you hold for an hour or for a week.
How to combine indicators without overload
Curved’s indicator guide puts the biggest mistake plainly: indicator overload. Piling on tools that say the same thing creates false confidence. Its suggested alternative is a few complementary tools: one for trend, one for momentum, volume for confirmation.
A clean day trading template looks like this:
- Bias. On the 1-hour or 15-minute chart, decide whether price is above or below VWAP and whether the 20 EMA is rising or falling.
- Setup. On the 5-minute chart, wait for a signal in the direction of the bias: a Big Move Algo Long or Short, or a MACD cross that agrees with it.
- Confirmation. Check that volume is rising on the move.
- Stop and size. Place the stop first, then calculate the position.
- Exit. Exit on the opposite signal, your target or your stop, whichever comes first.
If you are testing any combination before going live, the backtest pitfalls checklist shows how to avoid fooling yourself with the results. For stock traders, regime filters matter as well: this mean reversion blueprint with regime filters shows how to judge whether conditions suit a given style before you trade it.
Risk: set the stop before the size
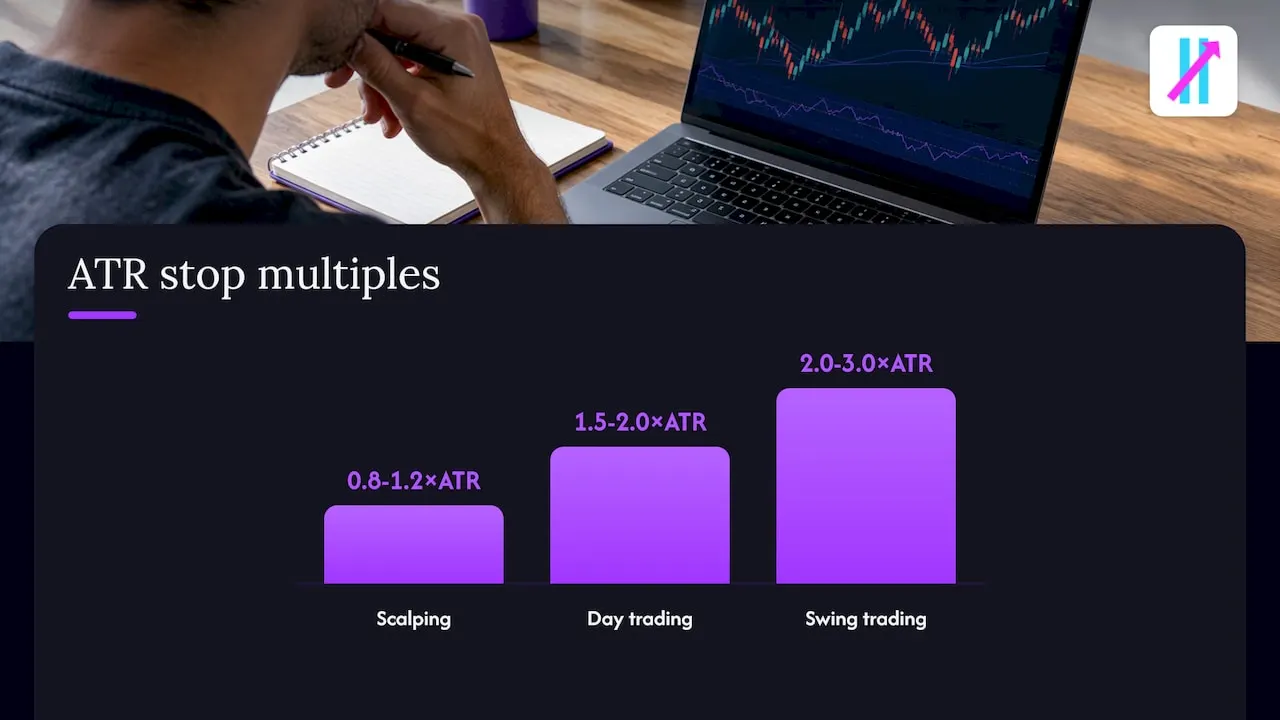
Signals decide when to enter. Your stop decides whether you survive being wrong. Curved’s stop-loss guide recommends ATR-based stops of 1.5 to 2.0 times the 14-period ATR for day trades (0.8 to 1.2 for scalps, 2.0 to 3.0 for swing trades), with shares calculated as account risk, for example 1% of the account, divided by the distance from entry to stop.
A worked example: you have a $25,000 account and risk 1%, or $250. The stock is at $50.00 and the 14-period ATR on your chart is $0.40. A 1.75 times ATR stop is $0.70 away, so the stop sits at $49.30. Shares = $250 ÷ $0.70, about 357 shares. If the stop were instead squeezed to fit a share count you picked first, the stop would land inside ordinary noise and get hit by normal chop. Curved calls that reversed order the most common stop-loss error in retail trading.
Day trading carries a real risk of loss. Use only capital you can afford to lose, and speak with a licensed financial adviser about your own situation.
Our perspective
Most traders we talk to do not lack information. They have five indicators open and no decision. The chart tells them everything and nothing.
We built Big Move Algo around one idea: a trader should be able to look at the chart and see a clear Long, Short or Exit, and just as importantly, see when the conditions are not worth trading. That is why the Fake Trend Detector sits at the center of it. Skipping a bad setup is a decision too.
AUTO Mode exists so you can start without tuning a dozen inputs. Manual Mode exists because experienced traders will want to shape the tool to their style. Because the signals are designed not to repaint, you can build a routine on what you actually see.
Pair it with a disciplined stop, a bias from a higher timeframe and volume for confirmation, and you have a structured system you can repeat every session.
Steven Hartwell
Get started with Big Move Algo
Big Move Algo is sold as a subscription, with instant access after purchase and payment processed through Stripe. Prices as published on our site:
- Version 2: $55 per month or $660 per year
- Version 3: $64 per month or $768 per year
- Version 3 Plus: $79 per month or $948 per year
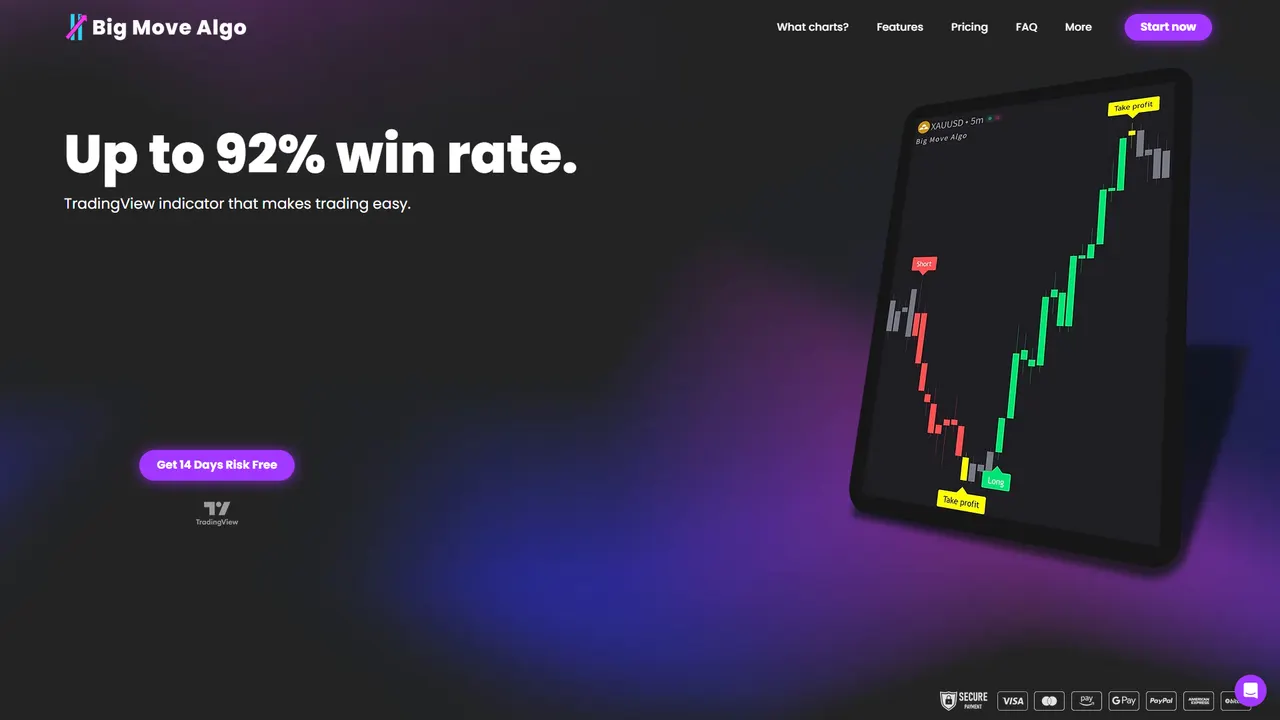
You can compare the plans and subscribe on the Big Move Algo site. If you also trade indices, our indices day trading setups show how the signals fit a morning routine.
FAQ
What is the best indicator for day trading?
There is no single best one, but VWAP is the most widely used intraday reference. Pair it with a trend tool such as a 9 or 20 EMA and a momentum reading such as MACD. If you want those judgments condensed into Long, Short and Exit signals, Big Move Algo does that on TradingView.
What is the best timeframe for day trading?
The 5-minute chart is the most common choice for US stocks, at about 78 candles per regular session. Use the 15-minute or 1-hour chart to read the trend and the 5-minute chart to time the entry. Scalpers may drop to the 1-minute chart, but it is noisier.
What timeframe is best for swing trading?
The daily chart defines the trend and a 4-hour chart is commonly used for entries. Some swing traders use the daily chart alone for stocks. Hold times of several days make ATR stops of 2.0 to 3.0 times the 14-period ATR a common starting range.
How many indicators should I use at once?
Two or three is enough: one for trend, one for momentum and volume for confirmation. Adding more of the same type clutters the chart. A single signal tool plus volume and a stop based on ATR is a clean setup.
Does Big Move Algo work on crypto, forex and stocks?
Yes. It works across crypto, forex, stocks, indices and commodities on TradingView, and it can send alerts to multiple platforms. AUTO Mode gets you started with minimal setup.
Sources
- CenterPoint Securities: Best Technical Indicators for Day Trading
- Fidelity: Understanding Indicators in Technical Analysis
- Fidelity: Determining entry and exit points with technical analysis
- Above the Green Line: Best Indicators for Day Trading
- QuantVPS: Best Indicators for Day Trading
- Curved: Best Day Trading Indicators 2026
- Curved: Best Timeframe for Day Trading Beginners 2026
- Curved: How to Set Stop Losses That Actually Work
- TraderNest: Best Timeframe for Day Trading
- Trade That Swing: What Time Frame to Use When Day Trading
- Pomegra: Swing Trading and Timeframes