Heikin Ashi vs. Candlesticks: Which Chart Should You Trade?
Standard candlesticks show what price actually did. Heikin Ashi candles show a smoothed, averaged version of it. That is the whole difference, and it decides how you should use each one: Heikin Ashi is for judging the trend, standard candles are for placing the trade. Most of the confusion around this topic comes from asking which one is “better” instead of asking which job you are doing at that moment.
Below you will find how each chart is built, a worked calculation, what the smoothing gives you and what it takes away, and a simple way to combine both on one TradingView layout. We also cover repainting, because traders often mix it up with the way Heikin Ashi bars behave.
TL;DR
- Regular candlesticks plot the real open, high, low and close of each period. Heikin Ashi plots averages built from the current and previous bar.
- Heikin Ashi makes trends easier to see and cuts noise, but it hides gaps and its close can differ from the real traded price.
- Use Heikin Ashi to read trend direction and strength. Use standard candles for entries, stops and targets.
- Heikin Ashi signals tend to arrive later than signals on regular candles, so judge your timing against real price.
- Repainting is a separate problem: it means an indicator’s past signals change after the fact.
Table of Contents
- How standard candlesticks and Heikin Ashi are built
- What Heikin Ashi shows better
- What Heikin Ashi hides
- Heikin Ashi vs. candlesticks side by side
- Which one fits your trading style
- A simple two-chart workflow in TradingView
- Lag, leading signals and why it matters here
- Heikin Ashi and repainting are not the same thing
- Our perspective on chart style and signals
- Put clear signals on the chart you already use
- Common mistakes to avoid with either chart
- FAQ
- Sources
How standard candlesticks and Heikin Ashi are built
A standard candlestick records four real prices for a period: open, high, low and close. The body spans open to close, and the wicks mark the extremes. Every candle is independent of the one before it, which is why gaps between one close and the next open show up on the chart.
Heikin Ashi (“average bar” in Japanese) uses the same candle shape but feeds it different numbers. The technique is credited to the Japanese rice trader Munehisa Homma in the 1700s. Each bar blends the current period with the previous Heikin Ashi bar, per the formulas laid out by Babypips:
| Heikin Ashi value | Formula |
|---|---|
| Close | (Open + High + Low + Close) ÷ 4 of the current period |
| Open | (Previous HA Open + Previous HA Close) ÷ 2 |
| High | Highest of the current High, HA Open and HA Close |
| Low | Lowest of the current Low, HA Open and HA Close |
Because every bar leans on the one before it, the chart carries momentum forward. That is where the smooth look comes from.
A worked example
Say the previous Heikin Ashi bar had an open of 100 and a close of 101. The current period prints a real open of 101, high of 106, low of 100 and close of 105.
- HA Close = (101 + 106 + 100 + 105) ÷ 4 = 103
- HA Open = (100 + 101) ÷ 2 = 100.5
- HA High = the highest of 106, 100.5 and 103 = 106
- HA Low = the lowest of 100, 100.5 and 103 = 100
The real close was 105. The Heikin Ashi close is 103. The candle still looks like a clean bullish bar, but if you read 103 as the price, you are off by two points. That gap is not a bug. It is how the method works, and Investopedia notes that the Heikin Ashi close may not match the actual market price, which is why many platforms display one number for the calculation and another for the live price.
What Heikin Ashi shows better
The appeal is visual. On a regular candle chart, a healthy uptrend still prints the occasional red candle, and each one makes you wonder whether the move is over. Heikin Ashi tends to string together runs of same-colored candles, so a trend reads as a trend.
Per Investing.com, consecutive green or red candles make trends easier to recognize, with green candles that have no lower shadows pointing to a strong uptrend and red candles with no upper shadows pointing to a strong downtrend. Investopedia lists five core readings:
- Green (hollow) candles with no lower shadow: strong uptrend.
- Green (hollow) candles: uptrend.
- Small bodies with shadows on both sides: possible trend change.
- Red (filled) candles: downtrend.
- Red (filled) candles with no upper shadow: strong downtrend.
Charles Schwab adds two useful habits. A single bar of the opposite color inside a run can be an anomaly rather than a reversal. And a shift from long-range candles to short ones with wicks on both sides can signal indecision, which may happen at a turning point.
The practical payoff is staying in a good trade longer. If you tend to exit winners early because a red candle spooked you, the smoothing can help you hold. The Corporate Finance Institute suggests pairing the technique with a trailing stop so you can stay with a strong trend while still protecting profit.
What Heikin Ashi hides
Smoothing is a trade. You get clarity and you give up detail. Three costs matter most.
Lag. Because the bars use averaged data from earlier periods, OANDA warns that signals can come late and that the chart responds less to fast market moves. Schwab makes the same point: signals may appear later than on a normal candlestick chart, and the method works best in strong trends rather than choppy, volatile markets. Investing.com adds that reversal patterns can take longer to form because each bar uses information from two periods.
No gaps. Heikin Ashi charts don’t show price gaps. The Corporate Finance Institute notes that most traders use gaps to judge momentum, trigger entries or position stop-loss orders, so losing them removes information.
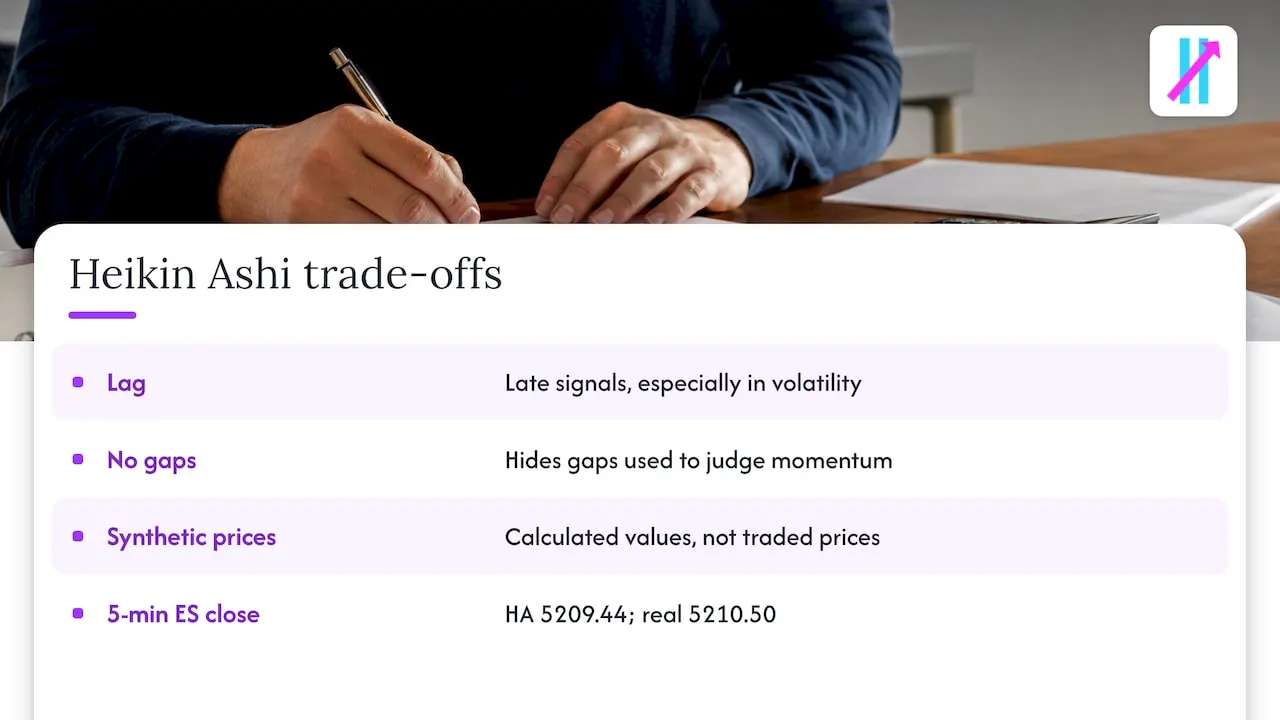
Synthetic prices. The open, high, low and close on a Heikin Ashi bar are calculated values, not traded prices. NexusFi Academy describes a 5-minute ES bar where the Heikin Ashi close was 5209.44 while the real close was 5210.50, a 1.06 point difference. It calls setting stops, targets and entries at levels read off a Heikin Ashi chart the most expensive mistake, because those levels may not correspond to prices that actually traded.
Heikin Ashi vs. candlesticks side by side
| Question | Standard candlesticks | Heikin Ashi |
|---|---|---|
| What does each bar show? | Real open, high, low, close | Averaged values built from the current and previous bar |
| Price gaps | Visible | Not shown |
| Trend readability | Good, but with more color flips | Smoother, longer runs of one color |
| Signal timing | Closer to live price | Tends to be later |
| Best use | Entries, stops, targets, pattern reading | Trend direction and strength |
| Risk if misused | Overreacting to noise | Treating synthetic prices as real ones |
Which one fits your trading style
The answer depends on your timeframe and what you are trying to decide.
Swing traders usually get the most from Heikin Ashi. On daily or four-hour charts, the noise reduction helps you stay with a move over days, and a slightly late signal costs less when you are holding for a larger swing.
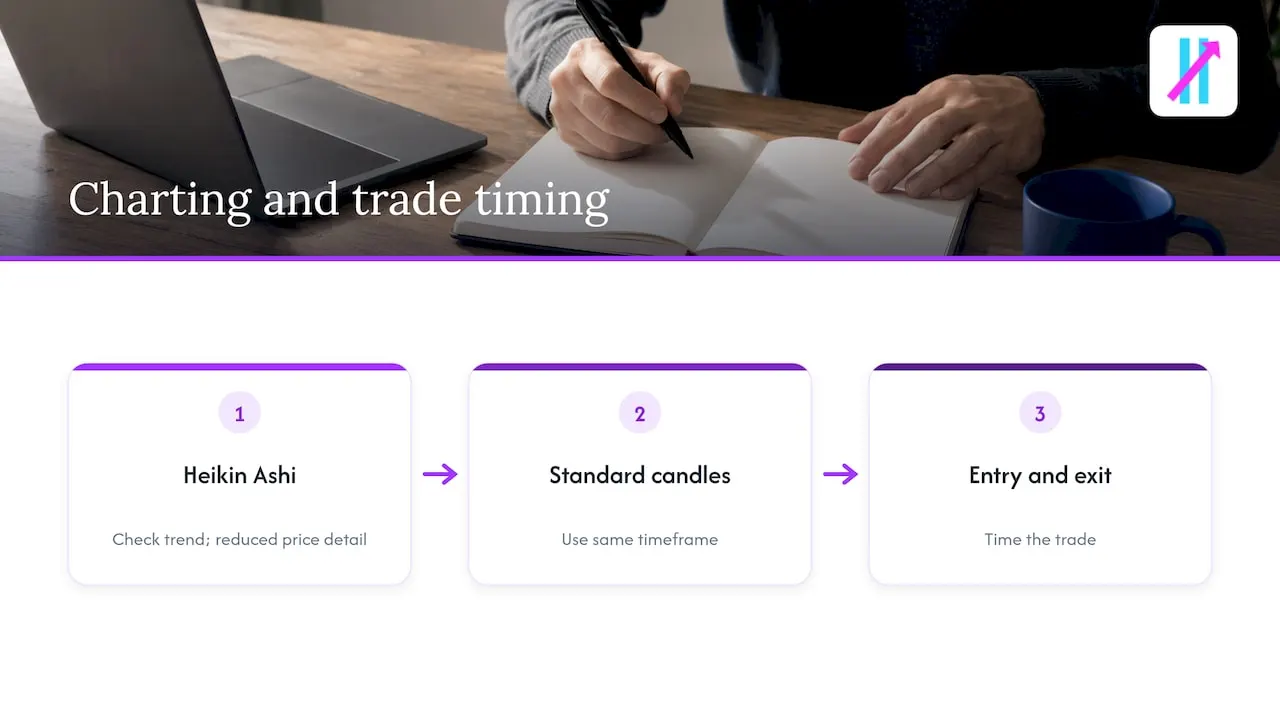
Day traders should be more careful. The Corporate Finance Institute says the lack of full price information makes the method unsuitable for day traders or scalpers, and one analysis from Quantified Strategies concludes Heikin Ashi is mostly a supplement to other indicators, with regular candlesticks better for entry and exit timing. A reasonable approach is to check the trend on Heikin Ashi, then drop to standard candles on the same timeframe to time the trade.
Beginners often like the clean look, which is fine, as long as they learn early that the price on the bar is not the price they can trade at. Build the habit of reading real price from a standard chart before you size a position.
Stock, forex and crypto traders can use either chart on any of these markets. Gap behavior is the main practical difference: stocks and some futures gap at the open, and Heikin Ashi will smooth that over.
A simple two-chart workflow in TradingView
You do not have to choose forever. TradingView lets you show a Heikin Ashi chart and a standard candle chart side by side, and this routine keeps the strengths of each:
- Read the trend on Heikin Ashi. Look for a run of same-colored candles and note whether the bodies are growing or shrinking.
- Switch to standard candles for the plan. Mark real support and resistance, and set your entry, stop and target on real prices only.
- Treat small-bodied Heikin Ashi bars with two-sided wicks as a caution flag. Per Schwab, that pattern can mark indecision near a turning point. Tighten risk rather than guess.
- Don’t act on a single opposite-colored bar. Wait for confirmation on the next one or two bars.
- Size risk from real price distance. An ATR-based stop on the standard chart is easier to defend than one drawn from a smoothed bar.
If you want a tidier layout, our guide to TradingView chart setup best practices covers how to keep a chart readable, and one-indicator clean chart trading shows how ATR stops and alerts fit on a minimal chart.
Lag, leading signals and why it matters here
Heikin Ashi is a lagging tool by design. That is not a flaw so much as a description, and it helps to know what lag does and doesn’t do for you. It confirms what has already started. It does not predict. If you want the rule of thumb on when a lagging read is enough and when you need something faster, see our breakdown of lagging vs. leading indicators.
The same logic applies to trend strength. A smooth run of green candles looks convincing, but it does not tell you whether a breakout is real. Pairing a chart style with a strength measure helps you avoid chasing weak moves, which we cover in trend strength rules for avoiding false breakouts. And if reversals are what you are hunting, how to detect trend reversals goes deeper than any single candle type can.
Heikin Ashi and repainting are not the same thing
People searching for this topic often ask about repainting, so it is worth separating the two ideas.
Repainting is when an indicator’s past output changes after you have seen it. TradingView’s own definition, as quoted by CrossTrade, is script behavior that makes historical and realtime calculations or plots behave differently. On a live, unfinished bar, values such as the close are still moving, so a signal shown mid-bar can disappear or shift by the time the bar closes. On the history, the same signal can look flawless because only the final values are plotted.
Heikin Ashi smoothing is a different thing. It is a fixed formula applied to the chart. It lags and it uses synthetic prices, but the formula itself is not what people mean when they call an indicator a repainter. The live Heikin Ashi bar still moves until the period closes, like any other bar, so the same discipline applies: act on closed bars.
To spot repainting in any indicator you are considering:
- Watch it in real time on a live chart and note when signals appear. Then compare against the history after the bar closes.
- Use TradingView’s Bar Replay to step through the past and see whether the signals show up where the history says they did.
- Be suspicious of historical results that look too perfect, with almost no losing trades.
- Prefer signals that confirm on bar close.
Big Move Algo is built to give structured Long, Short and Exit signals, and our positioning is that it does not repaint. Whatever tool you choose, apply the checks above to your own workflow and take signals on confirmed bars.
Our perspective on chart style and signals
We hear the same story from traders: the chart is not the problem, the clutter is. They flip between Heikin Ashi, standard candles, three oscillators and a moving average ribbon, and then the signals disagree with each other and they freeze or overtrade.
Our view is that a chart style is a lens, not a strategy. Heikin Ashi is a good lens for trend. Standard candles are a good lens for price. What most traders are missing is a structured decision on top: when to go Long, when to go Short, and when to Exit. That is what we built Big Move Algo to provide on TradingView.
It is also why we built the Fake Trend Detector. Smooth candles can make a weak, choppy market look like a trend. Our detector is designed to flag low-quality conditions where trading may not be recommended, so a pretty run of candles does not talk you into a bad trade.
We also think setup should not be a project. AUTO Mode needs minimal setup so you can start quickly, and Manual Mode is there when you want to customize. Pick one chart style you can read at a glance, let the signals structure the decision, and keep your emotions out of the entry.
Steven Hartwell
Put clear signals on the chart you already use
If you trade on TradingView and want Long, Short and Exit signals without stacking indicators, Big Move Algo is our proprietary indicator for crypto, forex, stocks, indices and commodities. It analyzes markets in real time, offers AUTO and Manual modes, and includes the Fake Trend Detector to filter out low-quality conditions. Access is delivered instantly after payment through Stripe, and it works across unlimited devices with free updates.
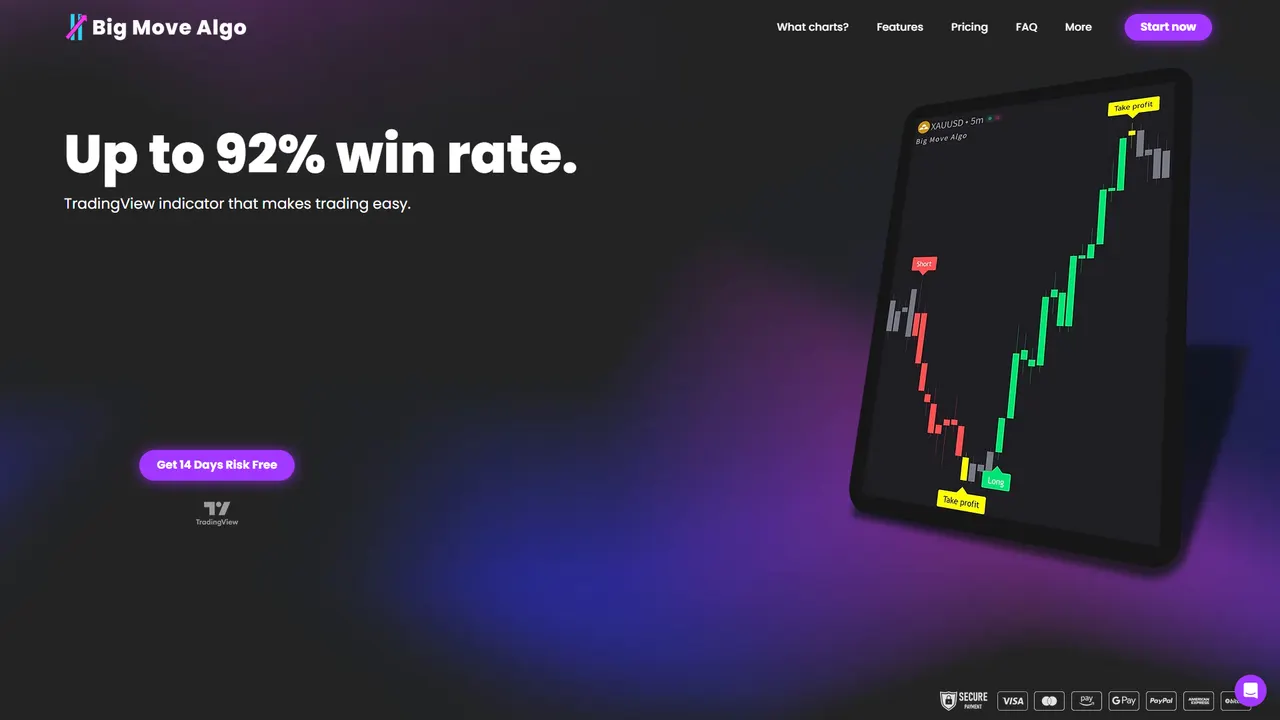
Published plans: Version 2 is $55 per month or $660 per year, Version 3 is $64 per month or $768 per year, and Version 3 Plus is $79 per month or $948 per year. You can see the current options on the Big Move Algo plans page. If you are still deciding on your platform, our comparison of the best charting platform for active traders is a good starting point.
Common mistakes to avoid with either chart
- Setting stops on Heikin Ashi levels. The bar’s high, low or close may not be a price that traded. Place orders from the standard chart.
- Entering on the first opposite-colored bar. Schwab flags a lone opposite bar as possible noise.
- Using Heikin Ashi for scalping. The averaging lag is the opposite of what a short timeframe needs.
- Ignoring conflicting signals. When your chart style says one thing and an oscillator says another, the cost adds up. We explain how in how conflicting indicators confuse traders.
- Treating a smooth trend as a strong one. Confirm with a trend-strength measure and with real price structure.
If you want to tune what your signals show on the chart, customizing TradingView chart trading signals walks through it, and our piece on trading stocks with technical signals shows how signals fit a stock workflow.
FAQ
Is Heikin Ashi better than regular candlesticks?
Neither is better for every job. Heikin Ashi is easier for reading trend direction because it smooths noise, while regular candlesticks show real prices, which you need for entries, stops and targets. Many traders use both together.
How accurate are Heikin Ashi candles?
They are accurate to their formula, but the values are averages rather than traded prices. Investopedia notes the bar’s close may differ from the actual market price, and Schwab says signals can appear later than on a normal chart. Use them to judge trend, not to pick exact price levels.
Do Heikin Ashi candles repaint?
The formula is fixed, so it is not repainting in the sense of an indicator rewriting its past signals. As with any bar, the live candle changes until the period closes, so wait for the close before acting. Repainting is about an indicator’s signals changing, not about a chart style.
Can I use Heikin Ashi for day trading?
You can, but with care. The Corporate Finance Institute says the lack of full price information makes it unsuitable for day traders and scalpers. If you day trade, use Heikin Ashi only as a trend filter and time entries on standard candles.
What does a bullish reversal look like on Heikin Ashi?
Per Investopedia, small-bodied candles with shadows on both sides suggest a trend change, and a shift to green candles with no lower shadows points to a strengthening uptrend. Wait for follow-through bars before treating it as a confirmed reversal.
Sources
- Investopedia: Master Trending Markets with Heikin-Ashi Charts
- Charles Schwab: How to Use Heikin Ashi Charts
- Babypips: Heikin Ashi Chart
- Corporate Finance Institute: Heikin-Ashi Technique
- Investing.com: Candlestick Patterns Explained
- OANDA: Heikin-Ashi candles explained
- NexusFi Academy: Heikin Ashi on TradingView
- Quantified Strategies: Heikin Ashi Trading Strategy
- Capital.com: Heikin-Ashi Trading Strategy
- CrossTrade: TradingView repainting explained