TradingView Chart Setup Best Practices for 2026
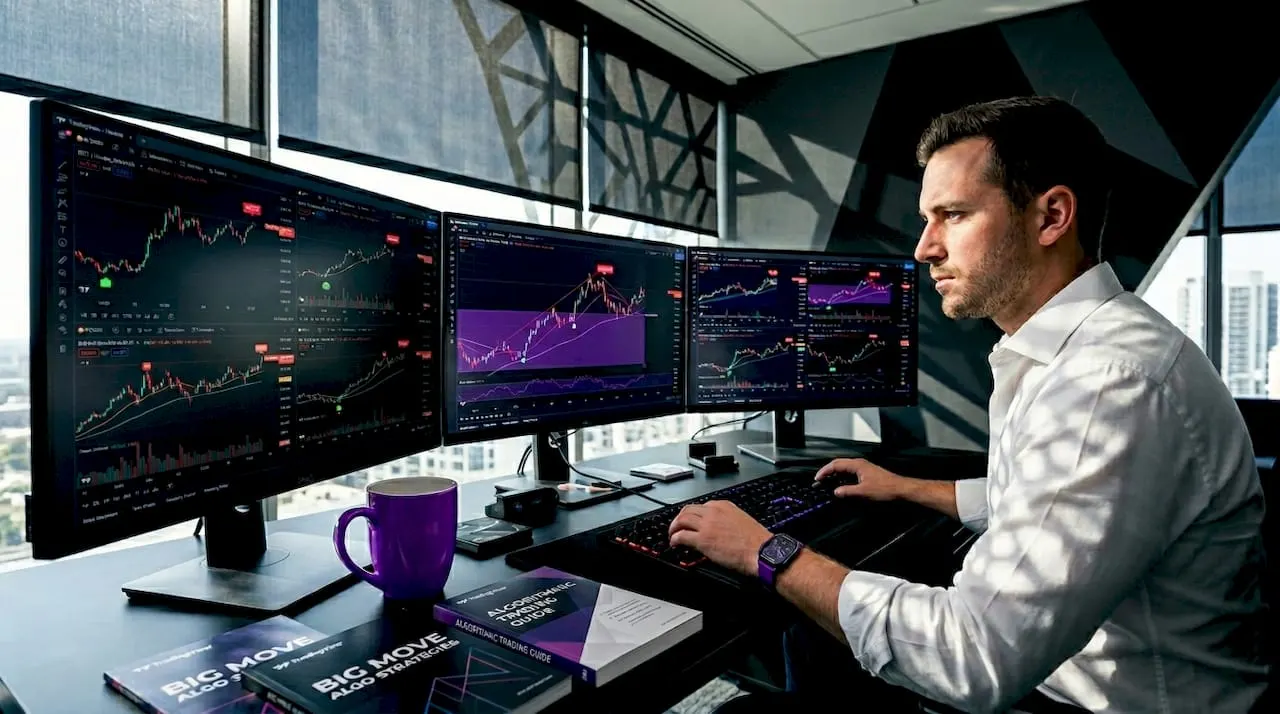
The best TradingView chart setup is defined by a consistent, repeatable decision workflow that reduces noise, eliminates guesswork, and keeps your analysis focused on what actually moves the needle. Most retail traders waste hours tweaking indicators instead of building a system that works the same way every session. The tradingview chart setup best practices covered here address layout design, indicator templates, alert presets, multi-chart syncing, and risk management integration. Each section gives you a concrete framework you can apply immediately, whether you are trading crypto on a phone or running four-pane equity setups on a desktop.
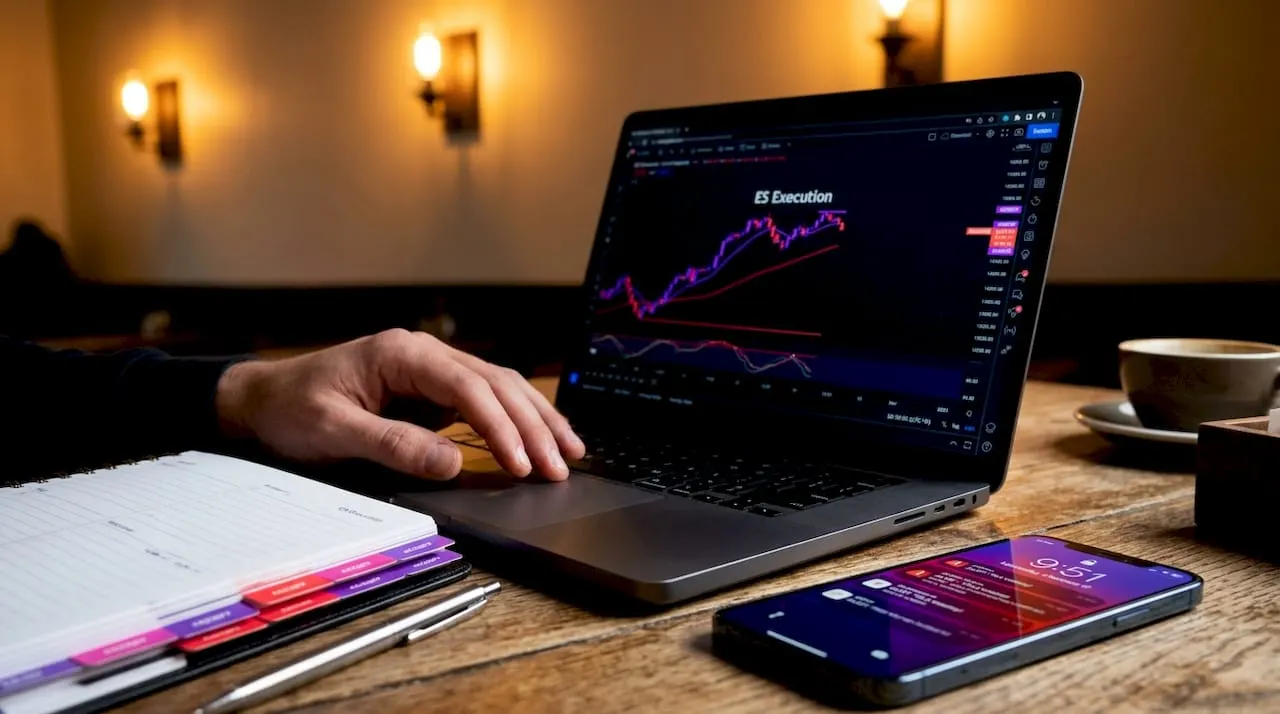
1. TradingView chart setup best practices start with layout roles
The single most important structural decision you make in TradingView is assigning a fixed purpose to each layout. Consistent layout design separates traders who execute with discipline from those who constantly second-guess their charts. Three layout roles cover the full trading cycle:
- Baseline layout: Shows higher-timeframe context, key structure levels, and trend direction. No entry triggers here.
- Execution layout: Stripped down to the indicators you need for entries and exits. Nothing else.
- Review layout: Annotated charts with trade notes, screenshots, and outcome tracking for post-session analysis.
Keeping these roles fixed prevents a common mistake: loading your execution chart with context indicators that slow your decision-making at the moment you need speed. Kevin Goldberg’s 2025 to 2026 guidance on layout strategies confirms that minimal overlays per layout directly reduce indicator noise and improve repeatability. The discipline is not in the setup itself. It is in refusing to add one more indicator to a layout that already works.
Pro Tip: Label each layout in TradingView with its role in the name, such as “BTC Baseline” or “ES Execution,” so you never open the wrong layout under pressure.
2. Indicator templates keep your chart setup consistent
Indicator templates in TradingView let you save a specific set of studies and apply them to any chart with one click. This matters because manually rebuilding your indicator stack every session introduces variation, and variation kills consistency. Saving templates per pane is the equivalent of version control for your analysis setup.
Three template categories cover most retail trading workflows:
- Trend analysis template: Moving averages, VWAP, and a momentum oscillator like RSI or MACD.
- Support and resistance template: Volume profile, pivot points, and horizontal levels drawn from the baseline layout.
- Entry confirmation template: A single signal indicator, a volume spike filter, and nothing else.
The key discipline here is limiting each template to three to five indicators. Fewer indicators in clean mode surface the decision anchors that matter most, rather than burying them under a wall of overlapping lines. When you need deeper validation, switch to your full-detail template. Do not run both simultaneously.
Pro Tip: Update templates incrementally, changing one indicator at a time and running the new version for at least two weeks before evaluating its impact on your decision quality.
3. Alert presets eliminate repetitive configuration
TradingView alert presets save conditions, names, notification settings, and trigger logic so you can apply a complete alert configuration to any symbol in seconds. Up to five presets can be stored and reused, which means traders who watch ten or more symbols stop rebuilding the same alert from scratch every time. That saved time compounds across a full trading week.
The practical workflow is straightforward. Create a preset for each phase of your trade cycle: one for context alerts that fire when price approaches a key zone, one for setup alerts that signal a pattern is forming, and one for execution alerts that trigger your entry criteria. Apply the relevant preset to each symbol on your watchlist. When a symbol rotates off your list, delete the alerts and reassign the preset to the next candidate.
Naming conventions matter more than most traders realize. An alert named “BTC 45k zone approach” tells you exactly what to do when it fires. An alert named “Alert 1” tells you nothing. Clear naming conventions reduce the cognitive load of managing a large alert stack and prevent you from acting on the wrong signal during a fast-moving session.
4. Structure your alerts in frequency tiers
A layered alert system uses three frequency tiers to match signal urgency to the action required. This structure prevents alert fatigue, which is the condition where you start ignoring notifications because too many fire at once.
- Context alerts (low frequency): Fire once when price enters a significant zone. These are informational. No trade action required.
- Preparation alerts (medium frequency): Fire when a setup pattern begins forming. This is your cue to open the execution layout and watch closely.
- Execution alerts (high priority): Fire when your entry criteria are fully met. These demand immediate attention and a decision.
Layered alert management reduces distraction and improves trade readiness by ensuring you only act on the highest-tier alerts during live sessions. Context and preparation alerts can be reviewed between sessions. This structure also works well with Pine Script’s alertcondition API, which lets strategy scripts trigger alerts with consistent messages across multiple symbols without manual reconfiguration.
5. Sync multi-chart layouts to reduce cognitive load
TradingView’s multi-chart sync options include symbol sync, interval sync, crosshair sync, and date range sync. Syncing multi-chart layouts means that when you move your crosshair on one pane, it moves on all panes simultaneously, which is critical for multi-timeframe analysis where you need to compare price action at the same moment across different intervals.
The top-left pane in any multi-chart layout controls the primary mobile view. This is not a cosmetic detail. If you manage trades on your phone, the top-left pane is the only chart you see. Assign your execution timeframe to that position, not your context chart. Traders who ignore this end up managing live positions on a daily chart when they intended to use a 15-minute view.
Starting with two charts before expanding to four is the recommended approach for most retail traders. Two panes force you to choose your two most important timeframes, which clarifies your analysis hierarchy. Adding a third and fourth pane only makes sense once your two-chart workflow is fully systematized.
6. Multi-timeframe setup: desktop vs. mobile comparison
Understanding how your setup behaves across devices prevents costly mismatches between your analysis environment and your execution environment.
| Setup element | Desktop | Mobile |
|---|---|---|
| Active panes | Up to 4 charts simultaneously | Top-left pane only visible |
| Sync priority | All sync options available | Follows top-left pane settings |
| Indicator templates | Full template switching per pane | Limited interaction, read-only recommended |
| Alert management | Full creation and editing | Review and dismiss only |
| Best use case | Analysis, planning, backtesting | Trade monitoring and execution alerts |
Desktop tab linking extends syncing across open tabs, allowing combined symbol, interval, and date range linking for backtesting and multi-timeframe review. Mobile is best treated as a monitoring tool, not an analysis tool. Build your setup on desktop and let mobile serve as the alert receiver and position monitor.
7. Incorporate risk management directly into your charts
Risk management belongs on the chart, not in a separate spreadsheet you check after the fact. Visible stop levels, position size reminders, and risk-to-reward annotations placed directly on your execution layout force you to confront your risk parameters before you enter a trade, not after.
A practical chart-based risk routine includes:
- Drawing your stop level as a horizontal line on the chart before placing the order.
- Adding a text annotation with your position size and maximum dollar risk for the trade.
- Marking your target levels with labeled lines so your exit plan is visible at all times.
- Taking a screenshot of the chart at entry and another at exit for your trade journal.
Tracking adherence to your stop-loss plan is more valuable than tracking win rate alone. A trader who takes 60% winners but moves stops repeatedly will underperform a trader with 45% winners and an iron stop discipline. Your TradingView chart is the place to enforce that discipline visually, not just intellectually.
Key takeaways
A disciplined TradingView setup built around fixed layout roles, minimal indicators, and structured alerts outperforms any complex multi-indicator system in both clarity and execution consistency.
| Point | Details |
|---|---|
| Assign fixed layout roles | Use separate baseline, execution, and review layouts to prevent decision conflicts. |
| Limit indicators per template | Three to five indicators per template keeps charts readable and decisions fast. |
| Use alert presets | Save up to five presets to apply consistent alert configurations across all watched symbols. |
| Prioritize the top-left pane | Assign your execution timeframe to the top-left pane to control your mobile trading view. |
| Put risk on the chart | Draw stop levels and annotate position size directly on your execution layout before every trade. |
Why most traders overcomplicate their setups and how to stop
I have watched hundreds of traders go through the same cycle. They start with a clean chart, add one indicator that helps, then add three more to confirm the first one, then add two more to filter the noise created by the previous three. Within a month, their execution layout looks like a circuit board and their win rate has dropped because they cannot read the chart anymore.
The traders who perform consistently are almost always running the simplest setups. Not because simplicity is a philosophy, but because consistency over complexity is what actually produces repeatable results. When your chart looks the same every session, your brain stops spending energy on interpretation and starts spending it on execution.
The mobile versus desktop gap catches people off guard more than almost anything else. You build a beautiful four-pane setup on your desktop, then try to manage a live trade on your phone and realize you are staring at your daily context chart while price is moving on the 5-minute. Fixing your top-left pane assignment takes thirty seconds. Not fixing it can cost you a trade.
My honest recommendation: lock your baseline layout. Put a password on it if you have to. The urge to “just tweak one thing” on a layout that already works is the single most destructive habit in retail trading.
— Big
How Big Move Algo simplifies your TradingView setup
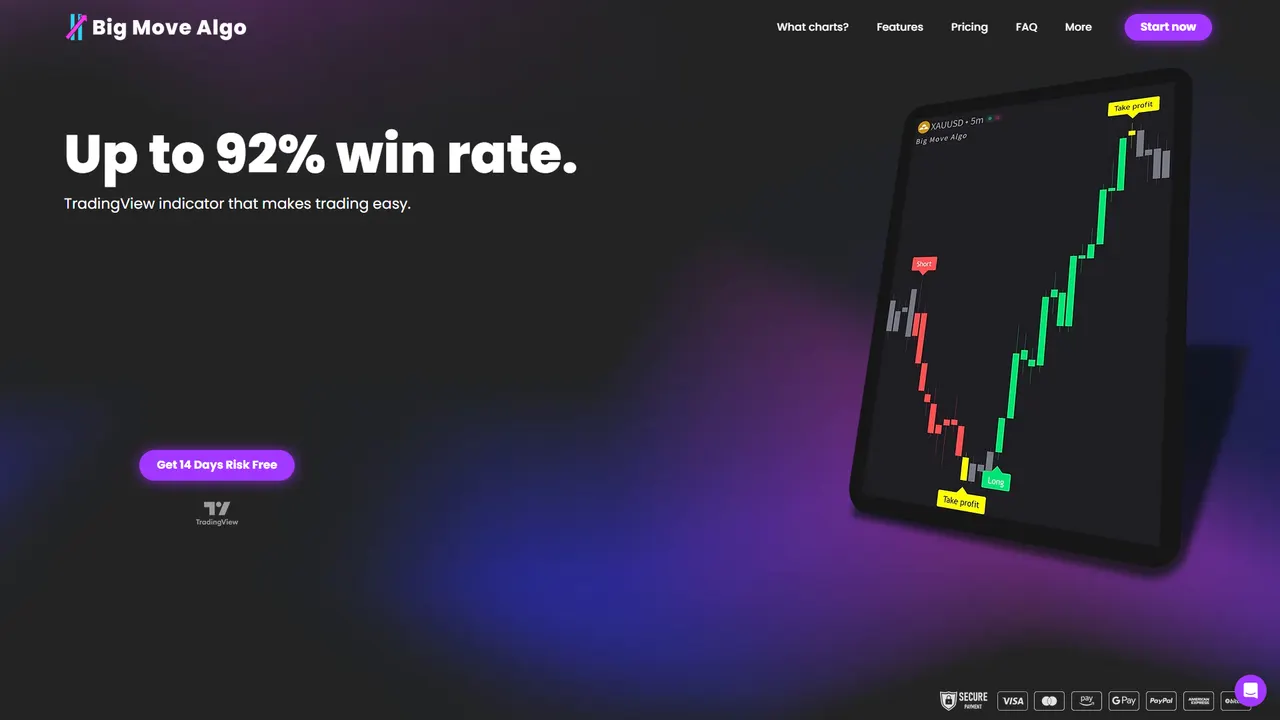
Bigmovealgo is built specifically to remove the setup friction that slows most retail traders down. The Big Move Algo indicator installs directly into TradingView and delivers clear Long, Short, and Exit signals without requiring you to build a complex indicator stack from scratch. AUTO Mode gets you running in minutes with a pre-configured signal layer that works across crypto, forex, stocks, indices, and commodities. The built-in Fake Trend Detector filters out low-quality market conditions automatically, so your alerts fire on real setups rather than noise. If you want to see how a purpose-built trading signal tool fits into the layout and alert framework described in this article, explore the available plans and get started with instant access after purchase.
FAQ
What is the best number of indicators for a TradingView chart?
Three to five indicators per chart pane is the practical limit for maintaining readability. Fewer indicators surface cleaner decision anchors and reduce the risk of conflicting signals.
How do TradingView alert presets work?
Alert presets save your full alert configuration, including conditions, names, and notification settings, so you can apply the same setup to any symbol instantly. TradingView allows up to five stored presets per account.
Which pane should I use as my main chart in a multi-layout setup?
The top-left pane controls the primary mobile view in TradingView’s multi-chart layouts. Assign your execution timeframe to that position so your mobile monitoring matches your active trading context.
How many charts should a beginner use in TradingView?
Start with two charts showing different timeframes of the same instrument. Starting with two charts before expanding to four prevents information overload and forces you to clarify your analysis hierarchy early.
Should I include risk management tools directly in my TradingView layout?
Yes. Drawing stop levels, target lines, and position size annotations directly on your execution chart forces you to define your risk before entering a trade, which is the most reliable way to maintain stop discipline.