How to Use TradingView for Multiple Markets
- Steven Hartwell

- 3 hours ago
- 8 min read

TradingView is the most widely used charting platform for multi-market analysis, giving traders a single workspace to monitor stocks, forex, crypto, commodities, and indices simultaneously. To use TradingView for multiple markets effectively, you need to combine its multi-chart layouts, overlay tools, and broker integrations into one structured workflow. This guide covers every layer of that setup, from choosing the right subscription plan to executing trades across asset classes without leaving your charts.
What plans and tools do you need for multi-market analysis on TradingView?
The free plan on TradingView limits you to a single chart per tab. That works for casual price checks, but it is not built for traders who need to track correlations, compare timeframes, or monitor several assets at once.
Multi-chart layouts are a paid feature, unlocked across four subscription tiers: Essential (2 charts per tab), Plus (4 charts), Premium (8 charts), and Ultimate (16 charts). The jump from free to Essential is where multi-market analysis actually becomes possible. Premium and Ultimate are built for active traders running complex cross-asset setups.

One tool is free regardless of plan: the Compare [+] button. This overlay tool lets you layer multiple instruments on a single price chart for quick correlation checks without upgrading. It is a solid starting point before committing to a paid plan.
Here is a quick comparison of what each plan delivers for multi-market work:
Plan | Charts per tab | Key multi-market features |
Free | 1 | Compare [+] overlay, basic alerts |
Essential | 2 | Multi-chart grid, layout saving |
Plus | 4 | Extended indicators, more alerts |
Premium | 8 | Volume profile, more data history |
Ultimate | 16 | Full layout control, priority support |
Key features to prioritize when choosing a plan:
Chart grid size: More panels mean more markets visible at once without tab switching.
Saved layouts: Higher plans let you save and reload custom multi-market setups instantly.
Alert limits: More alerts matter when you are watching several assets for breakout conditions.
Indicator limits: Cross-market analysis often requires multiple indicators running simultaneously.
How to set up multi-chart layouts for simultaneous market monitoring
Setting up a multi-chart grid in TradingView takes less than two minutes once you know where to look. The layout grid icon sits in the top right corner of the chart interface. Click it, and you will see options for 2, 4, 6, 8, or more chart panels depending on your plan.
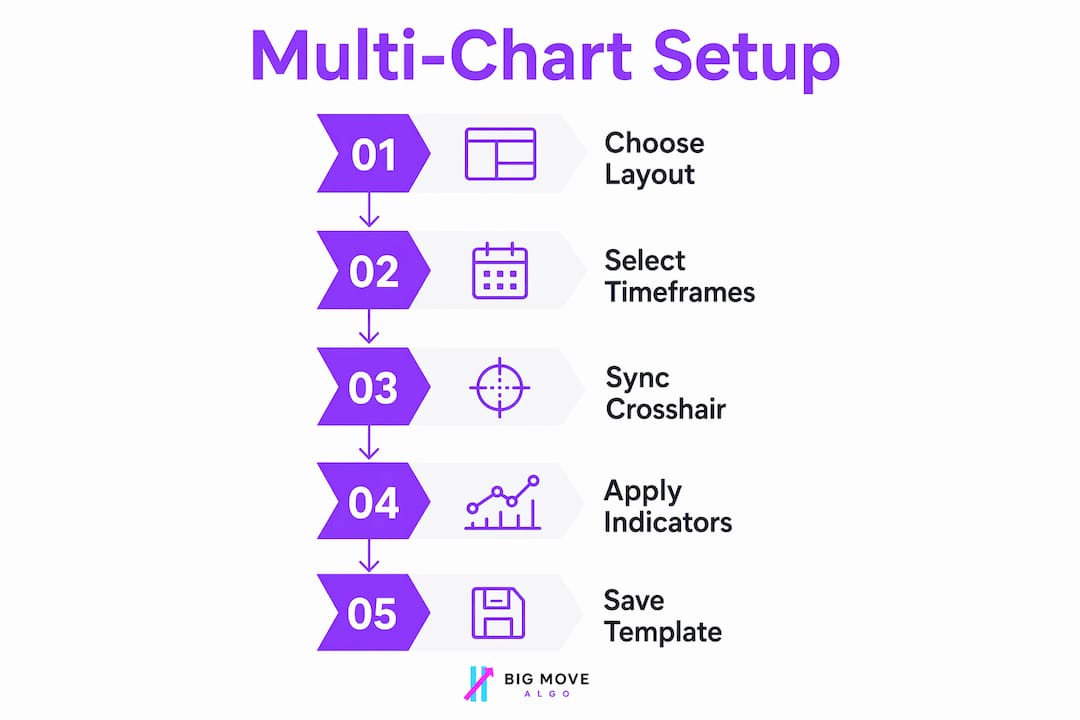
Here is a step-by-step process for building a functional multi-market layout:
Click the layout grid icon in the top right of your TradingView workspace and select your preferred grid size.
Assign a different asset to each panel by clicking inside a panel and typing the ticker symbol. For example: EUR/USD, BTC/USD, SPY, and GLD in a four-panel grid.
Set timeframes per panel based on your strategy. A top-down trader might use Daily, 4H, and 1H for the same asset across three panels.
Enable sync options by right-clicking a panel. You can sync symbol, timeframe, crosshair, or drawing tools across all panels or selected ones.
Save the layout using the layout name field at the top. This lets you reload the exact setup in one click during future sessions.
For structured multi-timeframe work, a 3-chart layout using Daily, 4H, and 1H is the most recommended configuration. It gives you the macro trend, the intermediate setup, and the entry-level timing in one view.
Multi-chart syncing is powerful, but it requires careful setup. Syncing the crosshair across all panels is useful for time-based correlation. Syncing the symbol across panels, however, defeats the purpose of a multi-market grid. Use symbol sync only when you want all panels to follow the same asset across timeframes.
Pro Tip: Build one layout for multi-timeframe analysis of a single asset and a separate layout for cross-market monitoring. Switching between saved layouts takes one click and keeps your workspace clean.
How does the Compare [+] overlay tool work for correlation analysis?
The Compare [+] overlay tool is available on every TradingView plan, including free. It lets you add one or more instruments directly on top of your primary chart, showing price movements as percentage-based lines rather than absolute values.
To use it, click the Compare [+] button at the top left of any chart, then type the ticker of the asset you want to overlay. You can add multiple instruments to the same chart. A forex trader might overlay EUR/USD, GBP/USD, and DXY on one chart to see how dollar strength is affecting multiple pairs at the same time.
Overlay use cases that deliver real analytical value:
Crypto cross-analysis: Overlay BTC/USD and ETH/USD to spot divergence before a major move.
Commodity spreads: Compare WTI crude and Brent crude to track the spread visually.
Sector rotation: Overlay SPY, QQQ, and IWM to see which segment is leading the market.
Forex correlation: Layer correlated pairs to confirm or question a directional bias.
The overlay approach has limits. When assets have very different volatility profiles, the percentage-based scaling can compress smaller moves and make correlations look tighter than they are. For deep analysis, a multi-chart grid gives you more control. Use overlays for quick checks and grids for structured decision-making.
Pro Tip: Combine the Compare +] tool with [TradingView overlay indicators from the Pine Script community to add custom correlation signals directly on your chart.
How do you connect brokers to TradingView for direct chart trading?
TradingView supports over 50 brokers for direct chart trading, covering stocks, forex, futures, and crypto. That broker count matters because different asset classes require different brokers. A trader running forex through OANDA and crypto through Binance needs both connected to trade from a single interface.
Here is how to connect and manage brokers inside TradingView:
Open the Trading Panel by clicking the “Trading Panel” button at the bottom of any chart.
Select your broker from the list. TradingView displays all supported brokers with their asset class coverage.
Authenticate your account. OAuth brokers like Interactive Brokers use a direct login window. API-key brokers require manual key generation and pasting, which adds a setup step and requires careful handling of your credentials.
Switch between brokers using the broker selector in the trading panel. You can have multiple brokers connected and toggle between them based on which market you are trading.
Place orders directly from the chart using the order panel that appears once connected. Limit orders, market orders, and stop orders are all supported for most brokers.
Broker | Integration type | Markets covered |
Interactive Brokers | OAuth | Stocks, futures, forex, options |
OANDA | OAuth | 70+ forex pairs, indices |
Binance | API key | Crypto spot and futures |
Advanced order types like TWAP or iceberg orders are not available through TradingView’s trading panel. For institutional-grade execution, route those orders through your broker’s native platform. TradingView handles core order types well, but it is not a full execution terminal.
Advanced tips for optimizing your multi-market workflow
Once your layouts and broker connections are in place, the next step is building habits and settings that keep your workflow fast and focused.
Use the desktop app for multi-monitor setups. The desktop app lets you pop out charts into separate windows, so each monitor can display a different layout. The web version locks everything inside one browser tab.
Organize watchlists by market segment. Grouping forex pairs, crypto assets, and equity indices into separate TradingView watchlists makes switching between markets fast. Organizing watchlists by segment and setting price alerts on key levels is one of the highest-leverage habits for multi-market traders.
Add market-wide context indicators. Placing BTC dominance, the VIX, or sector ETFs like XLF or XLE in a dedicated panel gives you macro context without opening a separate platform.
Pair TradingView with MT5 for automated strategies. TradingView excels at charting and analysis, while platforms like MetaTrader 5 handle automated execution. Running both in parallel is a common setup among active traders.
Avoid overloading your layout. Eight or more charts with multiple indicators each will slow your browser and scatter your focus. Start with four panels and expand only when your workflow demands it.
Pro Tip: Set TradingView alerts to trigger on multiple assets simultaneously and route notifications to your phone. This lets you monitor markets passively without keeping charts open all day.
Key Takeaways
TradingView’s multi-chart layouts, overlay tools, and broker integrations form a complete system for analyzing and trading multiple markets from one workspace.
Point | Details |
Plan selection matters | Paid plans from Essential to Ultimate unlock 2–16 charts per tab for real multi-market setups. |
Overlays are free and fast | The Compare [+] tool works on any plan and delivers quick correlation checks without extra cost. |
Broker integration varies | OAuth brokers like Interactive Brokers connect more smoothly than API-key brokers like Binance. |
Desktop app unlocks monitors | Pop-out windows in the desktop app let you spread layouts across multiple screens. |
Focus beats breadth | Tracking a defined set of markets with organized watchlists outperforms monitoring everything at once. |
Why I think most traders underuse TradingView’s multi-market tools
Most traders I have observed use TradingView as a single-chart tool. They open one asset, draw some lines, and close the tab. That approach misses the platform’s biggest strength: the ability to see relationships between markets in real time.
The traders who get the most out of TradingView are not the ones with the most charts open. They are the ones who have built a deliberate layout. A four-panel grid with a macro index, a sector ETF, a correlated currency pair, and the primary asset tells a richer story than four unrelated charts stacked together.
I have also seen traders over-invest in broker integration before they are ready for it. Connecting Interactive Brokers or Binance directly to TradingView is genuinely useful, but only if your analysis process is already solid. If you are still figuring out your entries, adding one-click execution just speeds up mistakes.
The most practical advice I can give is this: master one layout before building three. Pick two or three markets that are genuinely correlated to your primary trade ideas, build a layout around them, and use it consistently for 30 days. The pattern recognition you develop from that discipline is worth more than any indicator.
— Steven Hartwell
Take your TradingView analysis further with Big Move Algo
TradingView gives you the workspace. Big Move Algo gives you the signals to act on it.
Big Move Algo is a proprietary TradingView indicator that delivers real-time Long, Short, and Exit signals across crypto, forex, stocks, indices, and commodities. It runs directly inside TradingView, so it fits into any multi-chart layout you have already built. The built-in Fake Trend Detector filters out low-quality setups, so you are not chasing signals in choppy conditions. Whether you use AUTO Mode for a fast start or Manual Mode for custom control, Big Move Algo turns your multi-market TradingView setup into a structured decision system. Explore the full signal suite at Big Move Algo and see how it performs across the markets you already trade.
FAQ
What TradingView plan do I need for multiple charts?
The Essential plan is the minimum, giving you 2 charts per tab. Premium unlocks 8 charts and Ultimate unlocks 16, making them the best options for active multi-market traders.
Can I use TradingView for forex and crypto at the same time?
Yes. TradingView aggregates data from hundreds of exchanges, including Binance, Coinbase, and Bybit for crypto, alongside forex feeds from brokers like OANDA. You can display both in the same multi-chart layout.
Is the Compare [+] overlay tool free on TradingView?
The Compare [+] tool is available on the free plan and lets you layer multiple instruments on one chart for correlation analysis without any paid subscription.
Can I trade multiple markets directly from TradingView?
Yes, but you need separate broker accounts for different asset classes. TradingView supports over 50 brokers and lets you switch between connected accounts inside the trading panel.
Should I use TradingView or MetaTrader for multi-market analysis?
TradingView is the stronger choice for charting and analysis across multiple markets. MetaTrader 5 is better suited for automated strategy execution. Many active traders run both platforms together for the best of each.
Recommended
Comments