
Lagging vs Leading Indicators: The Rule Traders Actually Need
- Steven Hartwell

- 1 day ago
- 7 min read

Leading indicators try to predict where price is headed. Lagging indicators confirm where it already went. The rule that turns that distinction into money: let a lagging tool set your directional bias, use a leading tool to time the entry, and check volume before you pull the trigger.
A setup you can paste into TradingView right now: 50 EMA for bias (price above it, you only take longs), RSI 14 for entry timing (buy when RSI dips toward 40 to 50 in an uptrend rather than waiting for oversold at 30), and OBV to confirm real participation behind the move.
Leading indicators: early signals, prone to false positives, best in ranges
Lagging indicators: confirm trend after it starts, slower, more reliable in trends
The rule: bias from lagging, timing from leading, volume as the tiebreaker
Key Takeaways
Pairing one lagging trend indicator with one leading momentum indicator, plus a volume check, outperforms stacking multiple redundant oscillators.
Point | Details |
Match tool to regime | Use lagging indicators in trends, leading indicators in ranges, confirmed by ADX and EMA slope. |
Avoid redundancy | Never stack RSI, Stochastic, and Williams %R together since they measure the same momentum input. |
Confirm with volume | Add OBV or a volume spike as the final filter before acting on any signal. |
Set alerts on crossovers | Use TradingView crossover alerts instead of static price levels to reduce noise. |
Automate carefully | Route only confirmed Exit or Entry signals to execution bots to limit costly false triggers. |
Table of Contents
What Are Leading Indicators in Trading?
Leading indicators try to signal a turn before price actually turns. Most of them are oscillators built from momentum math, plotted on a bounded scale so you can eyeball overbought and oversold zones without doing the math yourself.
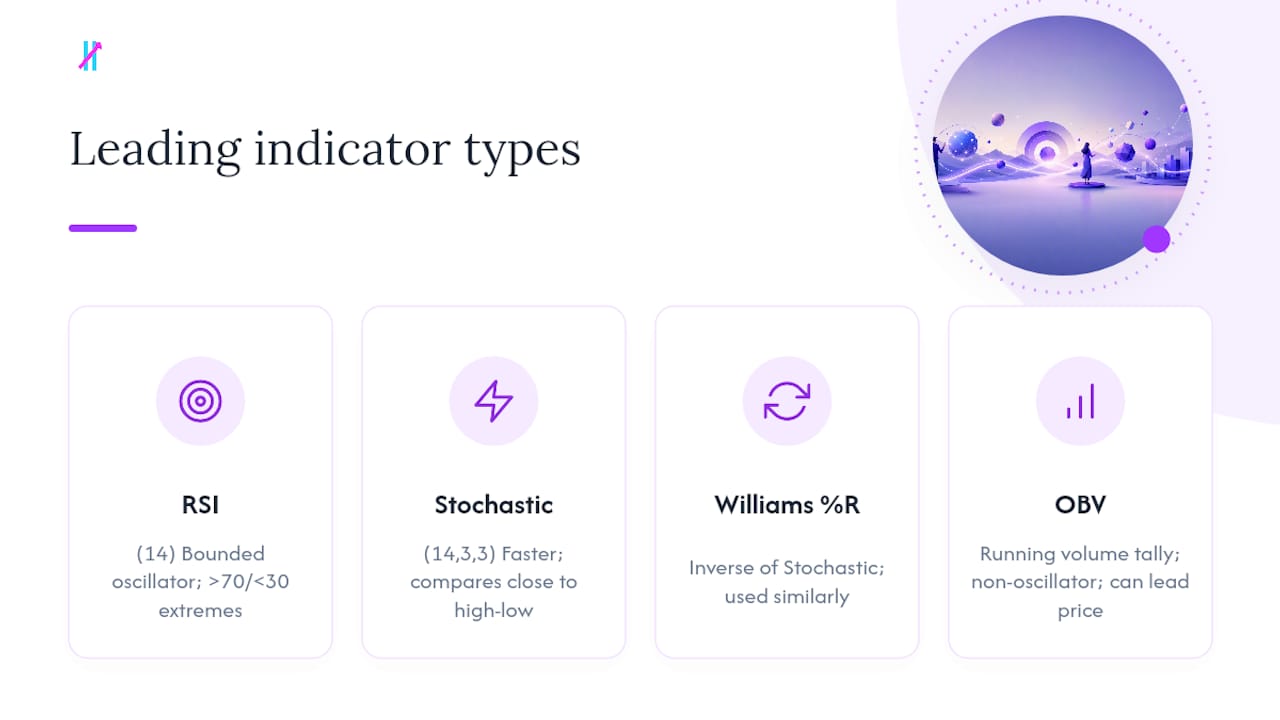
RSI (14 period) is the standard. Readings above 70 suggest exhaustion on the buy side, below 30 on the sell side. Stochastic (14, 3, 3) does something similar but reacts faster because it compares closing price to the recent high-low range rather than smoothing gains and losses over time. Williams %R is a cousin of Stochastic, flipped on its axis, and traders use it the same way. OBV (On Balance Volume) doesn’t oscillate at all. It’s a running tally of volume flow that leads price when big players are accumulating quietly before a breakout shows up on the candle chart.
The catch: leading indicators anticipate price but are prone to false signals, and the failure mode is predictable. In a strong trend, RSI can sit above 70 for days. Traders who short every “overbought” reading during a genuine uptrend get run over repeatedly. Watch for prolonged extremes rather than treating the first overbought print as a signal.
Where leading tools shine: ranging intraday charts, volatile crypto scalps, and any session where price is chopping sideways rather than trending. That’s roughly where oscillators outperform trend-following tools, based on how markets actually behave across regimes.
What Are Lagging Indicators, and Why Do They Confirm Trends?
Lagging indicators definition, in plain terms: they’re built entirely from historical price, so they tell you what already happened rather than what’s about to happen. That delay is the point. It filters noise.
Moving averages (SMA or EMA) are the clearest example. A 50 EMA sloping upward with price trading above it is about as simple a trend filter as exists. MACD takes that a step further, tracking the relationship between two EMAs and firing a signal when they cross, which confirms momentum shifts a bar or two after they begin. Bollinger Bands, built on a 20-period SMA plus standard deviation bands, flag volatility expansion but need price confirmation before you treat a band touch as a breakout. Parabolic SAR plots dots that flip sides when a trend reverses, useful for trailing stops more than entries.
Use the 50 EMA slope for directional bias, not for timing entries
Confirm momentum shifts with a MACD cross rather than a single candle
Treat Bollinger Band breaks as a heads-up, not a trigger
Lagging tools perform best on daily and 4-hour charts in markets that are actually trending. Their weak spot is choppy, directionless price action, where moving averages whipsaw and MACD crosses fire in both directions within days, burning you on fees and false starts.
Should You Use Leading or Lagging Indicators Right Now?
The answer depends on market regime, and you can figure out the regime in about ten seconds.
Check price against a 50 or 100 EMA. Flat, choppy price hugging the average signals a range. A clear slope with price riding one side signals a trend.
Check ADX. Readings below 20 usually mean a range. Above 25, you’re likely in a trend worth following.
Check ATR relative to its recent average. Expanding ATR alongside a sloping EMA confirms a trending regime; flat ATR confirms a range.
The rule of thumb that follows: lean on lagging tools in trending regimes, lean on leading tools in ranging regimes. Oscillators tend to outperform in sideways markets, while trend-following tools outperform once price commits to a direction, which is exactly why using one tool for every condition is the mistake most retail traders make.
Timeframe matters too. Scalpers on 1 and 5-minute charts live and die by leading signals because trends rarely last long enough for lagging confirmation to matter. Swing traders on 4-hour and daily charts should flip that ratio, using lagging tools for bias and leading tools only for fine-tuning entries. Position traders on weekly charts can often skip leading indicators altogether.

Pro Tip: Run this three-step check before every session, not just once a week. Regimes shift faster than most traders update their bias.
Two quick workflows: in a ranging crypto pair, ADX under 20, flat EMA, you’d wait for RSI to tag 30 and OBV to tick up before buying the bounce. In a trending forex pair, ADX above 30, EMA sloping hard, you’d wait for a MACD cross in the trend’s direction and ignore RSI overbought warnings entirely.
Building a Lean Setup: One Lagging, One Leading, One Volume Check
Stacking five oscillators on one chart doesn’t give you five opinions. It gives you one opinion repeated five times, because RSI, Stochastic, and Williams %R all draw from the same momentum math. That redundancy is the single biggest reason retail charts look busy and still produce bad trades. A cleaner rule is to pair one lagging trend tool with one leading momentum tool and add a volume read, skipping anything that duplicates a category you’ve already covered.
Three setups worth copying directly into TradingView:
Trend pairing: 50 EMA (bias) + MACD (12,26,9) cross (timing) + OBV rising (confirmation)
Range pairing: Bollinger Bands 20,2 (structure) + RSI 14 (timing) + volume spike on the bounce
Crypto scalp pairing: 20 EMA (bias) + Stochastic 14,3,3 (timing) + OBV divergence check
Setting alerts takes a few clicks. Right click the indicator, choose “Add Alert,” and set the condition to a crossover rather than a static price level so you’re not staring at charts all session. For a quick backtest, use TradingView’s Bar Replay to walk through the last 100 to 200 candles and count how often your pairing would have caught real moves versus false starts before you risk live capital.
Add your lagging trend tool first and confirm the chart still reads clean
Layer one leading momentum tool, not two
Add a volume indicator (OBV or plain volume) as the final filter
Two price-derived tools plus one volume read beats five oscillators competing for the same signal, every time.
How Big Move Algo Applies These Rules on TradingView
Getting this right manually means adding indicators one at a time, picking a timeframe that matches your trading style, setting crossover alerts, and paper-testing before risking real money. That’s the correct process, and it’s also where most retail traders lose patience.
Add a trend tool for bias, a momentum tool for timing, a volume tool for confirmation
Match your timeframe to your holding period before touching any settings
Set alerts on crossovers, not static levels
Paper-test for at least two weeks before going live
Big Move Algo builds that bias, timing, and filter pattern into a single TradingView indicator instead of asking you to assemble it by hand. AUTO Mode applies the trend-plus-momentum logic automatically and outputs Long, Short, and Exit signals. Manual Mode lets more experienced traders adjust sensitivity. The built-in Fake Trend Detector acts as the volume-style filter, flagging conditions where a signal looks premature.
Pro Tip: If you’re connecting signals to an execution bot, start with webhook alerts on Exit signals only, since a missed exit costs more than a missed entry.
The Mistakes That Wreck Otherwise Good Setups
Three mistakes account for most blown trades: stacking redundant oscillators, trading a leading signal while ignoring the regime, and chasing a signal after it already printed instead of waiting for the next valid one.
Check bias first. Your lagging tool has to agree with the trade direction before anything else matters.
Confirm with the leading tool. Only act once your entry indicator lines up with that bias.
Check volume or a higher timeframe. A move without volume behind it is the classic false leading signal.
Example: RSI dips to 28 on a 5-minute chart, tempting a long. But the 50 EMA on the 1-hour chart is sloping down hard. That’s bias disagreement, and it’s the signal to skip the trade, not take it.
An Editorial Take on Building Signals That Actually Hold Up
Most guides on this topic treat leading and lagging indicators as a menu, pick your favorites and hope for the best. That’s backward. The research here supports a much narrower conclusion: the pairing matters more than either tool alone, and most traders fail not because they picked the wrong indicator but because they never checked whether their tools agreed with each other before entering.
The conventional advice oversells oscillators to beginners because they’re visually satisfying. RSI hitting 30 feels like a signal. It’s often just noise inside a trend that has months left to run. What actually protects capital is the boring discipline of checking regime first, then bias, then timing, in that order, every single time.
If you take one thing from this piece, prioritize the sequence over the tool selection. A mediocre indicator used in the right regime with the right pairing will outperform a brilliant indicator used alone in the wrong one.
— Steven Hartwell
Sources
Recommended
Comments