
Risk-Reward Ratio: The Math That Decides If Your Trade Is Worth Taking
- Steven Hartwell

- 11 minutes ago
- 13 min read

The risk-reward ratio (R:R) is the distance from your entry to your stop, measured against the distance from your entry to your target. You calculate it before you click buy, not after, because it’s the single simplest filter that protects your expectancy over the long run.
Here’s the rule that matters more than the ratio itself: R:R means nothing without a win rate attached to it. A risk/reward ratio of 1:3 sounds great until you realize your setup only wins 15% of the time. Pair the two numbers, always.
Risk = entry price minus stop price (the dollars you lose if wrong)
Reward = target price minus entry price (the dollars you gain if right)
R:R = reward divided by risk, usually written as 1:2, 1:3, and so on
Breakeven anchor: a 1:2 ratio needs roughly a 33% win rate just to break even, before fees
A moderate baseline ratio often mentioned among retail traders is that a desirable ratio involves risking less than the potential reward; however, this varies by individual strategy and market conditions. The rest of this guide shows you how to calculate it, test it, and adjust it so it actually holds up when real money is on the line.
Key Takeaways
Pairing your risk-reward ratio with a verified win rate and disciplined stop placement is what actually determines whether a trading strategy makes money over time.
Point | Details |
Ratio needs a win rate | A 1:3 ratio is worthless without knowing your setup’s actual historical win rate at that distance. |
Breakeven math is fixed | Use breakeven = 1 ÷ (1 + reward multiple); a 1:2 ratio needs roughly 33% wins to break even. |
Structure beats arbitrary targets | Anchor stops to invalidation points or ATR multiples, then let the ratio follow the chart. |
Track realized R, not just planned R | Journal every trade’s actual exit versus planned exit to catch early profit-taking and slippage. |
Big Move Algo enforces the plan | Its AUTO and Manual modes flag entry, stop, and target levels before emotion can override the setup. |
Table of Contents
How Does Win Rate Determine Whether a Ratio Actually Pays Off?
Setting Stops and Targets from Market Structure, Then Sizing the Trade
Does Your Trading Style Change What Ratio You Should Target?
How Do You Actually Test Whether Your R:R Assumptions Hold Up?
How Big Move Algo Keeps Your Planned Ratio From Becoming a Guess
What Is the Risk-Reward Ratio and How Do You Calculate It?
The formal calculation needs exactly three price points: your entry, your stop-loss, and your take-profit target. Everything else is arithmetic.
Entry price — where you actually get filled, not where you planned to get filled.
Stop-loss price — the level that proves your trade idea wrong.
Take-profit price — the level where you plan to exit with a gain.
The formulas differ slightly depending on direction:
Long trade: Risk = Entry − Stop Reward = Target − Entry R:R = Reward ÷ Risk
Short trade: Risk = Stop − Entry Reward = Entry − Target R:R = Reward ÷ Risk
Say you go long a stock at $50.00, set a stop at $49.00, and a target at $53.00. Risk is $1.00 per share, reward is $3.00 per share, giving you a 1:3 ratio. Flip it for a short: sell at $50.00, stop at $51.00, target at $47.00. Risk is $1.00, reward is $3.00, same 1:3 ratio, opposite direction.
Quick math check: A 1:3 ratio doesn’t mean you’ll make three times your risk on every trade. It means your planned reward is three times your planned risk. What you actually collect depends on fills, slippage, and whether you hold to target.
That gap between planned and realized R is bigger than most traders expect. FundedFast’s analysis notes that realized R typically runs lower than planned R because of slippage, partial exits, and the simple psychological pull to close a winning trade early. If you backtest a strategy assuming perfect fills at your exact target price, you’re testing a fantasy version of your own system. Build in a discount, mentally or in your spreadsheet, before you trust the numbers.
Notation matters too. Some traders write “R” as a unit, where 1R equals your initial risk amount. A trade that hits 2R made twice what it risked. This shorthand gets used constantly in trading journals and forums, so get comfortable with it early. When someone says “I got stopped out for negative 1R and my last winner was plus 4R,” they’re describing the exact same math you just learned, just compressed into a single letter.
Worked Examples: Forex, Stocks, Crypto, and Short Trades
Numbers on a page mean little until you run them against a real chart. Here’s how the same formula plays out across four different markets.
Forex example. You’re trading EUR/USD, currently at 1.0850. You go long with a stop at 1.0820 (30 pips of risk) and a target at 1.0940 (90 pips of reward). That’s a 1:3 ratio. On a standard lot, each pip is worth roughly $10, so your risk is $300 and your target profit is $900.

Stock example. You buy a stock at $80.00 with a stop at $77.00 ($3.00 risk per share) and a target at $89.00 ($9.00 reward per share), a 1:3 ratio. Divide $250 by the $3.00 per-share risk, and you get roughly 83 shares. Your total position costs about $6,640, well within a normal account allocation, and your dollar risk stays fixed regardless of how many shares you actually buy.
Crypto example. Bitcoin trades at $62,000. Because crypto swings harder than most equities, your stop needs more room, say $60,000, a $2,000 risk. Your target sits at $68,000, a $6,000 reward, again a 1:3 ratio. But slippage on fast crypto moves is real. A stop meant to trigger at $60,000 might fill at $59,700 during a sharp drop, especially on lower-liquidity exchanges. Widen your assumed risk slightly when position sizing crypto trades to account for that gap.
Short trade example. You short a stock at $120.00 after a failed breakout, setting your stop at $124.00 ($4.00 risk) and your target at $108.00 ($12.00 reward), a 1:3 ratio. The math is identical to a long trade, just mirrored. Traders new to shorting often miscalculate this because they subtract in the wrong direction. Double-check your stop is above your entry and your target is below it before you submit the order.
Always calculate risk in dollars, not just price distance, before deciding position size.
Widen your slippage buffer on crypto and after-hours equity trades.
A 1:3 ratio on paper only matters if your stop actually triggers where you planned it.
How Does Win Rate Determine Whether a Ratio Actually Pays Off?
A risk-reward ratio by itself tells you nothing about profitability. You need the breakeven win rate, and then you need your actual historical win rate to compare against it.
The breakeven formula is simple: breakeven win rate = 1 ÷ (1 + reward multiple). Plug in your ratio and you get the minimum win percentage required to avoid losing money over time, before fees.
R:R | Reward Multiple | Breakeven Win Rate |
1:1 | 1 | 50% |
1:2 | 2 | roughly 33% |
1:3 | 3 | 25% |
1:4 | 4 | 20% |
That breakeven math comes straight from DayTradingToolkit’s breakdown of common R:R targets, and it explains why a 1:3 setup that only wins 20% of the time is still a losing strategy over a large sample, even though “1:3” sounds aggressive and profitable on the surface.
Expected value (EV) takes this one step further. The formula is:
EV = (Win rate × Reward) − (Loss rate × Risk)
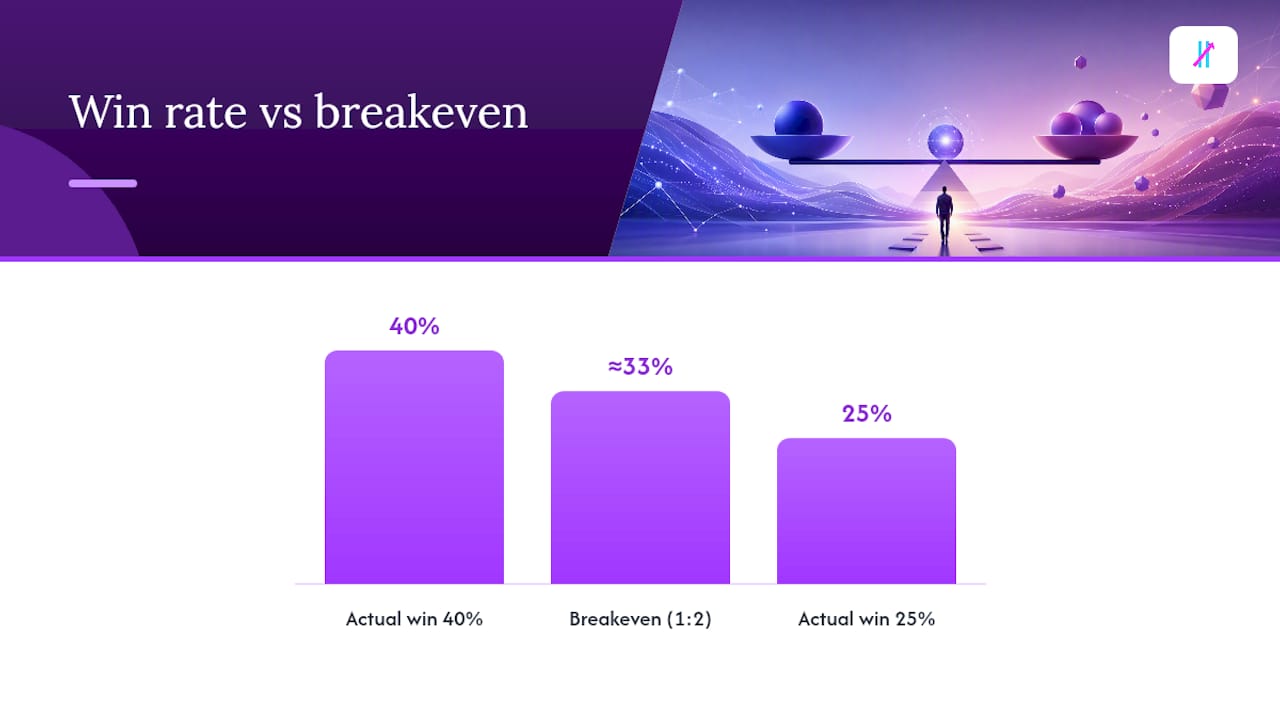
Say you run a strategy with a 1:2 ratio and a 40% historical win rate. EV = (0.40 × 2) − (0.60 × 1) = 0.80 − 0.60 = +0.20R per trade. Positive expectancy, meaning the strategy makes money over enough trades, assuming your win rate holds up.
Now flip the numbers. Same 1:2 ratio, but your actual win rate is only 25%. EV = (0.25 × 2) − (0.75 × 1) = 0.50 − 0.75 = −0.25R per trade. Negative expectancy. The ratio didn’t change, but the strategy went from profitable to a slow bleed, because the win rate collapsed.
This is exactly why Investopedia’s treatment of R:R stresses that the ratio has to be combined with probability and trading costs to mean anything at all. A trader chasing a 1:5 ratio because it “sounds better” than 1:2, without checking whether their setup can actually win at that distance, is solving the wrong problem.
Pro Tip: Pull your last 30 to 50 trades and calculate your actual win rate at your typical R:R. If your real number is below breakeven, don’t widen your stop to force a better ratio, fix your entry criteria instead.
The practical guidance here is backward from what most beginners assume: pick the R:R that fits your setup’s historical win rate, don’t pick a win rate and then force a matching ratio onto the chart.
Setting Stops and Targets from Market Structure, Then Sizing the Trade
Stops and targets shouldn’t come from an arbitrary ratio you decided you wanted. They should come from the chart, and the ratio is whatever falls out of that.
Anchor your stop to an invalidation point. This is the price level where your original trade idea is proven wrong, a swing low, a broken support level, a failed retest. If the price hits it, you were wrong, period.
Use ATR as a volatility filter, not a replacement for structure. A common approach sets stops at 1.5 to 2 times the Average True Range beyond your invalidation point, which keeps you from getting stopped out by normal noise. The ATR-based stop guide walks through practical multiplier defaults across different timeframes.
Avoid clustering your stop at obvious round numbers. Everyone else’s stop is sitting at the same psychological level, and market makers know it.
Let the target come from the next real resistance or support zone, not from multiplying your risk by whatever ratio you’d like to see.
Structure-driven stops beat mechanical fixed-ratio rules because chart structure reflects where actual buyers and sellers showed up, not where a formula says they should be. A fixed “always use 1:3” rule is easy to backtest, but it ignores whether the market has room to move that far before hitting resistance.
Once your stop distance is set, position sizing becomes mechanical:
Position size = (Account size × Risk %) ÷ Stop distance per unit
Position size = $225 ÷ $1.50 = 150 shares. Your dollar risk stays fixed at $225 no matter how the R:R ratio shakes out on that particular setup, because you’re sizing to risk, not to conviction.
Funded account programs complicate this further.
Pro Tip: If you’re on a funded evaluation with a daily drawdown cap, calculate your max consecutive-loss tolerance before you calculate your R:R. The drawdown rule, not the ratio, is what actually disqualifies you.
Where Risk-Reward Discipline Breaks Down in Live Trading
Most R:R mistakes aren’t math errors. They’re discipline errors that happen after the trade is already live.
Forcing an unrealistic ratio. Stretching your target to hit 1:4 because it “looks better” on your trading journal, even when the next resistance level sits well before that price.
Early profit-taking. You planned a 1:3 trade, it moves in your favor, and you close at 1:1 out of fear it’ll reverse. Your planned R and your realized R are now two completely different numbers, and if you do this consistently, your backtested edge stops applying to your live results.
Ignoring costs on small timeframes. A five-pip spread barely matters on a 100-pip swing trade. It’s brutal on a 15-pip scalp, where the cost alone might eat 20% or more of your total risk before the trade even starts.
Skipping the win-rate check. Trading a ratio that “feels right” without ever pulling your actual historical performance at that ratio.
Widening stops mid-trade to avoid a loss. This inflates your risk after the fact and quietly wrecks your entire R:R calculation for that trade.
The corrective action for most of this is a pre-trade checklist: confirm your stop is at a genuine invalidation point, confirm your target sits at a real structural level, confirm your position size matches your account risk rule, and commit to the exit before you enter. Write it down. Trades planned in the heat of the moment almost always drift toward whichever ratio feels emotionally comfortable, not whichever ratio the chart actually supports.
Pro Tip: Screenshot your entry, stop, and target the moment you place the trade. Compare it to your exit screenshot later. The gap between the two is your real planned-versus-realized divergence, and it’s usually bigger than traders expect.
Does Your Trading Style Change What Ratio You Should Target?
Your holding period changes what’s realistic, and treating every trading style with the same R:R expectation is one of the more common planning mistakes retail traders make.
Scalping typically works with tight ratios, often close to 1:1 or 1:1.5, because trades last minutes and there’s no time for price to travel far. Scalpers compensate with a higher win rate, frequently 60% or more, and high trade frequency.
Day trading usually sits in the 1:1.5 to 1:2.5 range, balancing enough room for a real move with the reality that intraday structure limits how far price typically travels before the session closes.
Swing trading can reasonably target 1:2 to 1:4, since positions held for days or weeks have more room to reach distant structural targets, and traders can tolerate a lower win rate, sometimes in the 30% to 40% range, and still run positive expectancy.
Position trading stretches further still, sometimes 1:5 or beyond, on trades held for months, where the reward comes from capturing a large structural move rather than winning often.
Options trading breaks the standard R:R model because payoffs are asymmetric by design. A long call has capped, defined risk (the premium paid) against theoretically unlimited upside, which makes the ratio look enormous on paper. But that framing ignores time decay and the probability of the option expiring worthless, so options traders need to weight R:R against implied probability of profit, not just the raw payout ratio.
Volatility should adjust your numbers within any given style. A swing trade in a low-volatility stock might comfortably target 1:3 with a tight stop. The same setup in a high-volatility name during earnings week probably needs a wider stop to avoid noise, which naturally compresses the achievable ratio unless the target also moves further out. Adjust the stop first, based on current ATR, and let the ratio follow, rather than forcing a fixed number regardless of conditions.
How Do You Actually Test Whether Your R:R Assumptions Hold Up?
Numbers on a whiteboard are cheap. What separates a real edge from a hopeful guess is testing it against real price data before you scale up size.
Backtest the specific setup, not the ratio in isolation. Pull historical instances of your entry pattern, apply your stop and target rules, and record the actual win rate at that specific R:R. A systematic trading framework helps standardize this so you’re testing consistent rules instead of cherry-picked setups.
Forward-test with reduced size before trusting the backtest. Markets shift, and a pattern that worked on last year’s data doesn’t always hold going forward. Trade the same rules live, small, and compare your realized win rate and realized R against what the backtest predicted.
Journal every trade with the same fields. Entry price, stop price, target price, realized exit price, realized R-multiple, slippage, fees, and a short note on why you exited when you did.
A useful practitioner habit is checking historical win rate per setup type before adopting a specific R:R target, and verifying with a meaningful number of trades in backtest or forward-test before increasing position size. Guessing your edge from ten trades is a coin flip dressed up as data.
Tracking realized R against planned R across dozens of trades reveals your real, systematic edge, or the lack of one, far more reliably than any single winning trade ever will.
How Big Move Algo Keeps Your Planned Ratio From Becoming a Guess
Most of the mistakes covered above happen because a trader has to make a real-time judgment call under pressure. Where’s the stop? Is this actually resistance, or wishful thinking? An indicator that marks entry, stop, and target levels at the moment a setup appears removes a chunk of that improvisation.
Big Move Algo is built around that exact problem. It’s a TradingView indicator that reads market structure in real time and issues clear Long, Short, and Exit signals, so the entry, stop reasoning, and target logic are defined before emotion has a chance to creep in.
AUTO Mode requires minimal setup and works well for traders who want structured signals without configuring extensive parameters.
Manual Mode gives more experienced traders room to adjust settings to their own strategy and risk tolerance.
Fake Trend Detector filters out low-quality, choppy conditions where a technically valid setup still isn’t worth the risk.
Works across crypto, forex, stocks, indices, and commodities, with alerts deliverable to multiple platforms and support for unlimited devices.
None of this replaces the math covered earlier. It operationalizes it, so the stop level and target level you’d otherwise have to eyeball under pressure are flagged before you’re staring at a live candle deciding in real time. Pair signal timing with verified entries, as explained in the guide to clear long and short signals, and structural stop placement, covered in the ATR stop-loss breakdown, and you’ve got a repeatable process instead of a fresh decision every single trade.
The traders who consistently protect their expectancy aren’t the ones who found a magic ratio. They’re the ones who removed as many live decisions as possible from the moment the trade is actually open.
This guide was written with input from Steven Hartwell, whose focus is on translating trading math into rules retail traders can actually execute without a screen full of indicators competing for attention.
What the Ratio Actually Rewards and Punishes
The conventional advice tells retail traders to “aim for at least 1:2” and stop there, as if the ratio alone were a strategy. It isn’t. It’s not. It’s just a bigger number.
What gets underweighted is the planned-versus-realized gap. Traders will spend hours perfecting a stop-loss formula and then close winners early out of nerves, which quietly erases the edge they spent so long calculating. That gap is behavioral, not mathematical, and no ratio fixes it by itself.
If you take one thing from this guide, take this: calculate your actual historical win rate before you pick a ratio, and then build a process, whether that’s a checklist, a journal, or a tool that flags your levels in advance, that keeps you from abandoning the plan the moment the trade gets uncomfortable. The ratio was never the hard part. Sticking to it was.
— Steven Hartwell
Put Your Risk-Reward Rules on Autopilot
Calculating the perfect R:R on a spreadsheet is one thing. Holding to it when a trade is down $200 and your finger is hovering over the close button is another. That’s the gap Big Move Algo was built to close: it flags entry, stop, and target logic on the chart itself, before the trade is live, so the plan you calculated in a calm moment is the plan you actually follow under pressure.

The AUTO Mode gets you structured Long, Short, and Exit signals with minimal setup, while Manual Mode lets more experienced traders fine-tune parameters around their own R:R rules. The Fake Trend Detector adds a filter that flags choppy, low-quality conditions, exactly the environment where a technically valid ratio still isn’t worth the risk. It works across crypto, forex, stocks, indices, and commodities, with alerts across multiple platforms so you’re not glued to one screen.
If the math in this guide made sense but sticking to it in real time is where you struggle, visit the Big Move Algo landing page to see current subscription plans and start applying structured signals to your next trade.
Sources
Recommended
Comments