Stock Buy and Sell Signals: How They Work and Where They Fail

A stock buy or sell signal is a rule-based alert that tells you a price pattern has met a set condition. The condition might be a moving average cross, a momentum reading or a breakout. It is not a forecast, and no signal knows what happens next. Used well, a signal gives you a consistent trigger to plan around. Used badly, it becomes a shortcut that replaces research and risk control.
This guide explains how signals are produced, what “long,” “short” and “exit” mean, why signals fail, and how to build a routine that doesn’t depend on any single alert. We build a TradingView indicator that produces these signals, so we cover how we think about them too.
TL;DR
- A buy signal is a rule-based alert. A sell or short signal is the mirror image. Neither is a prediction.
- FINRA warns that indicators can throw false signals, especially in volatile markets, and should not be used in isolation.
- The signal is the easy part. Position size, stop placement, costs and taxes decide whether you keep your gains.
- Treat any signal tool as a filter for your own plan. Test it on a chart and with small size before you trust it.
Table of Contents
- What stock buy and sell signals actually are
- Long, short and exit: what the labels mean
- Do trading signals really work?
- Why signals fail: the common traps
- Which indicator gives the best buy and sell signals?
- A practical routine for using stock signals
- Our perspective: a signal is a decision aid, not a decision
- Using signals on TradingView
- Where Big Move Algo fits
- FAQ
- Sources
What stock buy and sell signals actually are
Every signal comes from the same place: a calculation on past price, and sometimes volume. The software watches a chart and checks whether a rule is true. When it flips from false to true, you get an alert.
The common building blocks are:
- Moving averages. These smooth out short-term noise. When a faster average crosses above a slower one, many traders read that as bullish. Fidelity’s technical analysis primer uses the 50-day and 200-day pair, the so-called golden cross and death cross, as the textbook example.
- Momentum oscillators. RSI and MACD are the best known. They measure how fast price is moving and whether that move looks stretched.
- Breakouts. Price clears a recent high or low, sometimes confirmed by volume.
- Composite scores. Some tools blend a dozen or more studies into one “consensus” reading. That is still a quantitative read of past action, not a recommendation.
If you want the math behind the alerts in more depth, we walk through it in how buy and sell signals are calculated. For a plain-language definition, see our piece on what a buy signal means for retail traders.
Long, short and exit: what the labels mean
People searching for equity trading signals often run into this vocabulary first, so here it is plainly.
| Signal | What it says | What you would do |
|---|---|---|
| Long (buy) | Conditions favor price rising | Buy shares, or open a position that gains if price rises |
| Short (sell short) | Conditions favor price falling | Borrow and sell shares, or use a product that gains if price falls |
| Exit | The condition that justified the trade has ended | Close the position, whether at a gain or a loss |
Two points trip up newer traders.
“Sell” and “short” are not the same thing. A sell signal on a stock you own means get out. A short signal means open a new bearish position. Shorting carries a different risk profile because the loss on a short can be much larger than the money you put in, since a stock has no price ceiling. If you only buy shares in a cash account, a short signal is information, not an instruction.
The exit is half the system. Most traders obsess over entries. A signal tool that doesn’t tell you when to get out leaves you improvising in the moment, which is when emotion takes over. We cover this in more detail in how to get clear long and short trading signals.
Do trading signals really work?
Honest answer: sometimes, in some conditions, and never reliably enough to run on autopilot.
There is no academic or institutional consensus that technical signals consistently beat the market. FINRA’s guidance on momentum investing, which is a form of market timing, notes that it takes years of study and practice and that indicators can produce false signals when markets get volatile.
Three structural reasons explain why.
Signals describe the past
An indicator is arithmetic on prices that already happened. It cannot account for an earnings surprise, a rate decision or a geopolitical shock. When one of those hits, a clean-looking setup can fail within minutes.
You are not the fastest participant
Institutional traders generally have better information and lower latency. Federal Reserve research on hedge fund ownership and price efficiency finds that, on average, larger hedge fund ownership is associated with more efficient pricing. In plain terms, sophisticated players are already working on the same patterns. A retail trader acting on a public signal is usually reacting after the first move, not before it.
Costs and taxes erode small edges
Frequent trading adds transaction costs and can create short-term capital gains. FINRA’s explainer on market timing lays out both, plus the risk of missing a recovery rally while you are out of the market. A signal that wins 55% of the time can still lose money after costs if the winners are small.
None of this means signals are useless. It means the signal needs a plan around it.
Why signals fail: the common traps
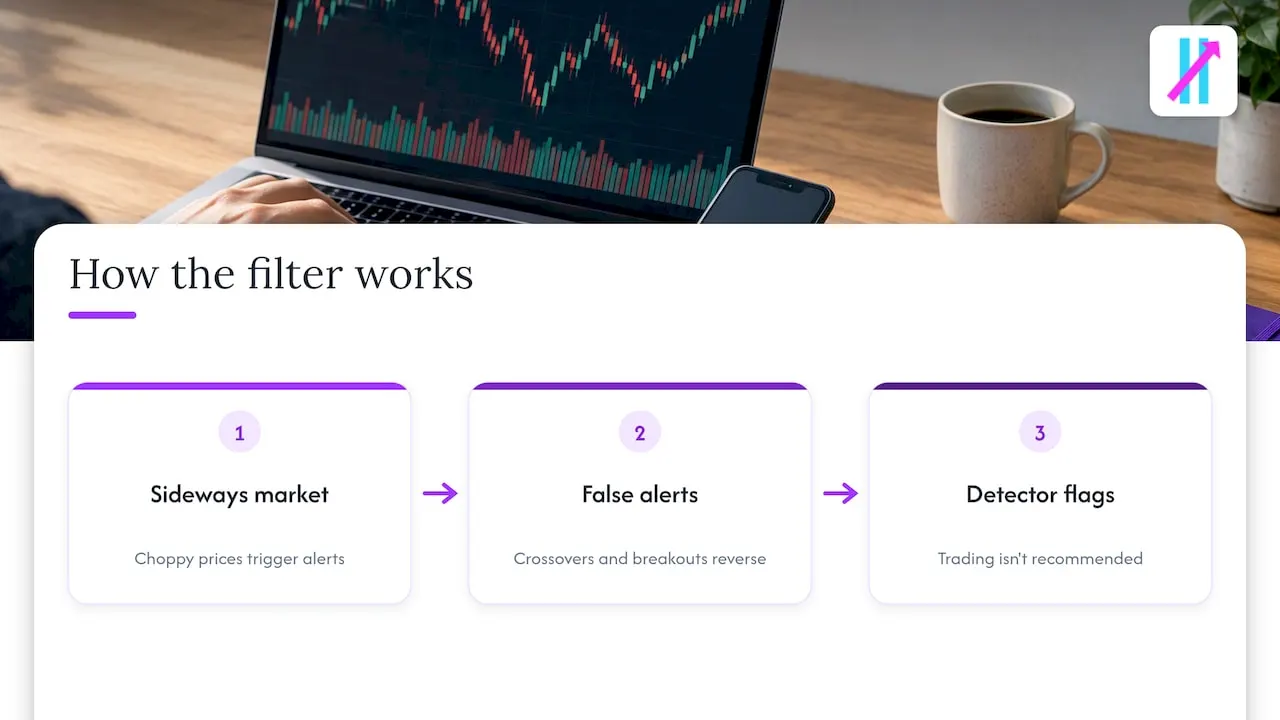
Trading every alert. Not every signal deserves capital. Choppy, sideways markets generate the most false alerts, because crossovers and breakouts keep triggering and reversing. This is the reason we built a Fake Trend Detector into our indicator: it flags conditions where trading is not recommended so you can skip them. A filter reduces low-quality setups. It does not eliminate losing trades.
Using signals instead of research. FINRA’s position is that the main danger is not the indicator but using it to bypass fundamental research and long-term planning. Pair technical timing with some view of the business behind the ticker.
Leverage. In margin accounts, forex and security futures, small adverse moves can produce losses larger than your deposit. The SEC’s forex investor bulletin explains how margin requirements can trigger automatic liquidation in fast markets, and FINRA’s security futures risk disclosure warns that you can lose a substantial amount in a very short period.
Signals that repaint. Some indicators redraw past signals so the history looks perfect. Always check how a tool behaves on live bars, not only on the historical chart. We state that Big Move Algo does not repaint, and you should still verify that yourself on a live chart during a trial period of your own small-size testing.
Social sentiment as a signal. FINRA and the SEC have published an investor bulletin on social sentiment tools that cautions about stale data and manipulation. A trending ticker is not a buy signal.
Believing automation fixes emotion. The SEC’s investor education material stresses that the discipline has to come from you. An alert that pings your phone can encourage constant checking and impulsive trades. Our article on benefits of automated trade signals covers where automation helps and where it doesn’t.
Which indicator gives the best buy and sell signals?
No single one. Readers asking about the best long short indicators are usually really asking which one fits their style. Use this as a rough guide.
| Style | Common tools | Weakness |
|---|---|---|
| Trend following | Moving average crosses | Late entries, whipsaws in sideways markets |
| Mean reversion | RSI, Bollinger Bands | Fights strong trends and can keep losing |
| Breakout | Range highs and lows, volume | Frequent false breakouts |
| All-in-one signal indicator | Rule-based Long, Short and Exit alerts | Only as good as its rules and your risk plan |
The real question is whether you can state, before the trade, why you are in, where you are wrong and when you take profit. If a tool lets you answer all three, it is useful. If it gives you only an arrow, you are guessing with extra steps.
A practical routine for using stock signals
- Define your market and timeframe. A day trader and a swing trader should not read the same signal the same way. Pick one stock universe and one or two timeframes.
- Check the market context first. Is the broad market trending or chopping? Is there a major data release or earnings report today?
- Screen the company. Technical timing works better when you aren’t buying something you can’t value. A free tool like this valuation multiples calculator for P/E, EV/EBITDA and P/FCF lets you compare a stock’s multiples against peers in a couple of minutes.
- Decide your risk before you enter. Set the stop first and size the position so a stop-out costs an amount you picked in advance, often a small percentage of the account.
- Plan the exit. Know whether you will follow the tool’s exit signal, a trailing stop or a fixed target.
- Account for costs. Include spreads, commissions and the tax rate on short-term gains in your expectations.
- Keep a journal. Record the signal, your reasoning, the result and whether you followed your rules. After 30 to 50 trades you have real data about your own results.
A word on extended hours: if your alerts fire before the open or after the close, read the SEC’s bulletin on after-hours trading first. Liquidity is thinner and prices can move sharply on small volume.
A word on day trading rules: the U.S. pattern day trader definition has long been four or more day trades within five business days in a margin account, with a $25,000 minimum equity requirement. The page notes that intraday margin standards are changing, so confirm the current rule with your brokerage before you trade frequently.
Our perspective: a signal is a decision aid, not a decision
We build trading software for retail traders, and we have a clear view of what it can and cannot do.
Most people who come to signals are not short on information. They are overwhelmed by it. They have six indicators with conflicting readings, a dozen settings and a nagging feeling they are late. The value of a good signal tool is clarity: one set of rules, applied the same way every time, that outputs Long, Short or Exit. That consistency is what we aim to deliver with Big Move Algo, and it is why we offer AUTO Mode for a fast start and Manual Mode for people who want more control.
What we won’t tell you is that clarity equals profit. A clean signal can lose, and a string of them can lose. The regulators quoted above are right that these tools describe past price action. That is why we tell new users to start with small size, to read about risk controls for automated trading, and to compare alerts and automation over a test period before they connect anything to real money.
If you take one idea from us, take this: the edge is less in the arrow on the chart and more in what you do after it. Sizing, stops, patience and skipping bad conditions are the work. A tool should make that work easier, never replace it.
— Steven Hartwell
Using signals on TradingView
TradingView is where many U.S. retail traders already chart stocks, which is why signal indicators are built for it. Alerts can be pushed to your phone, email or other platforms, and some traders connect them to automation. Our guide to TradingView buy/sell signals for active traders goes through setup, and examples of actionable trade signals shows what a usable alert looks like on a chart. If automation is new to you, start with what algorithmic trading is.
Whatever tool you choose, run this short test before paying for anything beyond a trial:
- Does the alert state direction, and does it also state an exit?
- Do signals stay put on live bars?
- Can you see how it behaves in a sideways market, not just a trend?
- Does it work on the stocks and timeframe you actually trade?
- Does the provider talk about risk as clearly as it talks about wins?
Where Big Move Algo fits
Big Move Algo is a TradingView indicator that gives Long, Short and Exit signals across stocks, crypto, forex, indices and commodities. AUTO Mode needs minimal setup, Manual Mode adds customization, and the Fake Trend Detector helps you sit out low-quality conditions. It works on unlimited devices, sends alerts to multiple platforms and includes free updates, with instant access after purchase through Stripe.
Plans, as published on our site:
| Plan | Monthly | Annual |
|---|---|---|
| Version 2 | $55 per month | $660 per year |
| Version 3 | $64 per month | $768 per year |
| Version 3 Plus | $79 per month | $948 per year |
If you already have a TradingView account, you can also change the TradingView account linked to your access. Whichever plan you pick, treat it as a tool inside your own plan, not a promise of returns.
FAQ
Do stock buy and sell signals really work?
They work as consistent triggers, not as predictions. FINRA notes that indicators can give false signals, particularly in volatile markets. Results depend on your risk management, costs and the market conditions you trade in.
What does a short signal mean?
A short signal says the rule set sees conditions favoring a price decline. Acting on it means selling short, which involves borrowing shares and can produce losses larger than your initial deposit. If you only buy shares, treat it as a warning or an exit cue instead.
Which indicator gives buy and sell signals?
Moving average crosses, RSI, MACD and breakout rules are the most common. All-in-one tools combine several into Long, Short and Exit alerts. The right choice is the one whose logic you understand and have tested on your own stocks and timeframe.
How do I know which stocks to sell?
Decide before you buy. Set an exit based on a stop level, a target or an exit signal, and write down the reason you entered. Sell when that reason is gone or your stop is hit, and talk to a licensed financial or tax professional about how a sale affects your taxes.
Sources
- What Is Momentum Investing? (FINRA)
- What Is Market Timing? (FINRA)
- Security Futures Risk Disclosure Statement (FINRA)
- Social Sentiment Investing Tools bulletin (FINRA and SEC)
- Investor Bulletin: Forex Trading (SEC)
- Investor Bulletin: After-Hours Trading (SEC)
- Hedge fund holdings and equity price efficiency (Federal Reserve)
- Pattern Day Trader (Investor.gov)
- What is technical analysis? (Fidelity)