TradingView Explained for Retail Traders in 2026
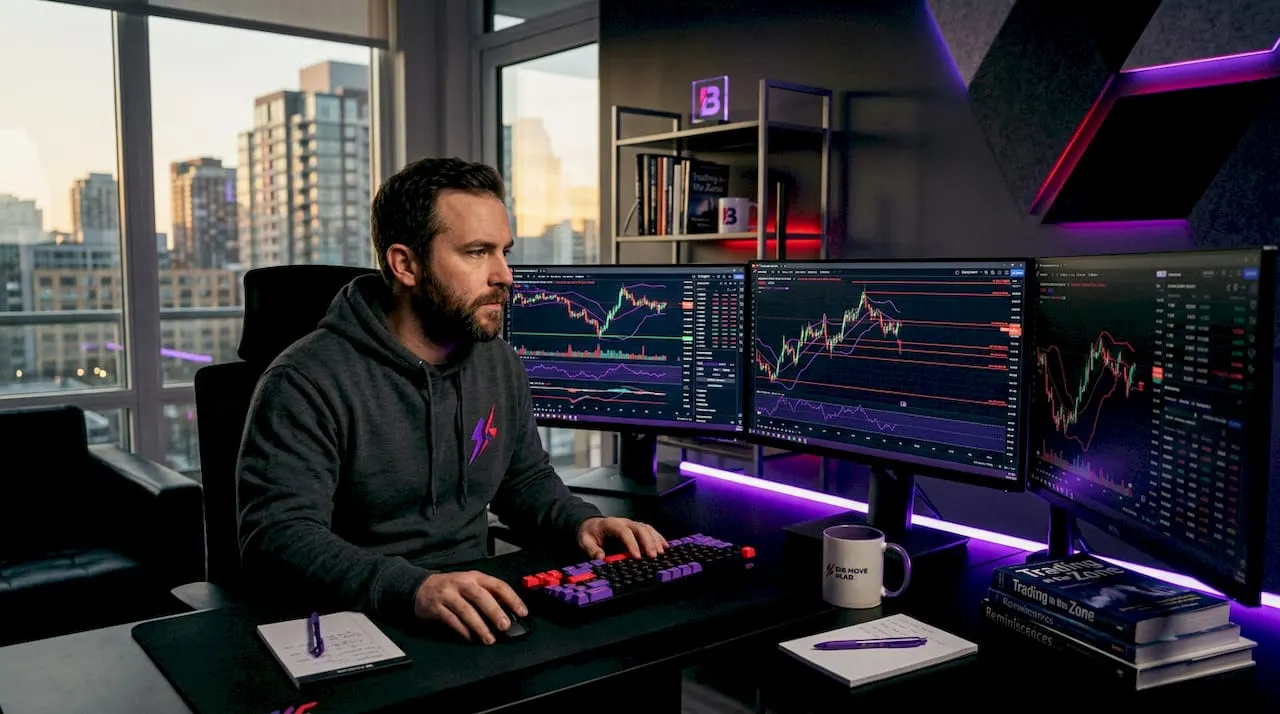
TradingView is defined as a web-based charting and social trading platform that gives retail traders access to professional-grade technical analysis tools directly in a browser. With over 60 million global users, it covers stocks, forex, crypto, indices, futures, and commodities under one roof. No software installation is required, and the platform works on desktop, mobile, and tablet. For anyone asking what is TradingView explained in plain terms, the short answer is this: it is the most widely used browser-based charting platform in the world, and it is free to start.
What is TradingView and why does it matter?
TradingView is a charting platform and financial data network built for traders at every level. It combines institutional-quality chart tools with a public community where traders share ideas, scripts, and analysis. That combination is rare. Most professional charting tools are expensive, desktop-only, and isolated. TradingView broke that model by making advanced analysis accessible to anyone with an internet connection.
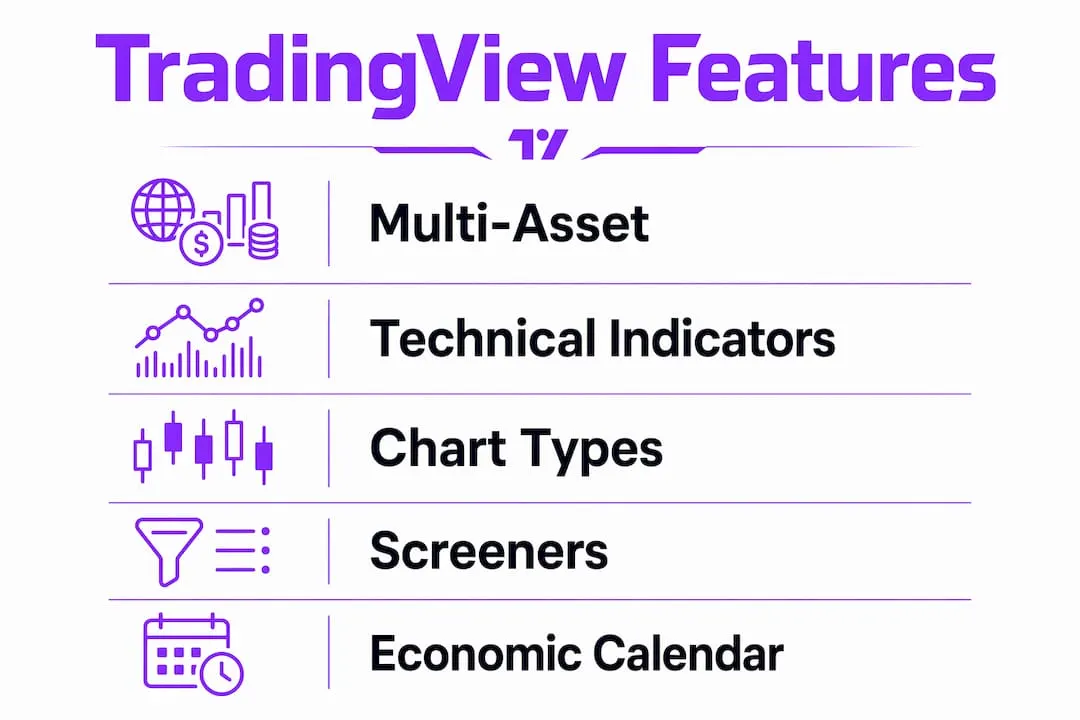
The platform supports multi-asset analysis across stocks, forex, crypto, indices, and futures, all from a single account. You can switch from analyzing Bitcoin to the S&P 500 to EUR/USD without logging into a different tool. That flexibility is one reason TradingView has become the default starting point for retail traders globally.
What separates TradingView from basic charting tools is its depth. The platform includes a scripting language called Pine Script, a built-in economic calendar, a news feed, market screeners, and a broker integration layer that lets you place trades directly from a chart. These are not add-ons. They are core features available at every subscription level, including the free plan.

What are the main features and tools TradingView offers?
TradingView’s feature set is one of the most thorough in retail trading. Understanding the TradingView tools available helps you decide which ones actually matter for your strategy.
Technical indicators and scripts
The platform provides over 400 built-in technical indicators and access to more than 100,000 community-created scripts through Pine Script. That number is not just impressive on paper. It means you can find a script for nearly any trading concept, from volume profile to Ichimoku Cloud variations, without writing a single line of code. Pine Script itself is TradingView’s proprietary scripting language, and it allows experienced users to build fully custom indicators and strategy backtests.
Chart types and drawing tools
TradingView supports candlestick, bar, line, Heikin Ashi, Renko, and several other chart types. Drawing tools include trend lines, Fibonacci retracements, Gann fans, pitchforks, and Elliott Wave tools. Multi-timeframe support lets you view the same asset on a 15-minute chart and a daily chart simultaneously. Overlays allow you to compare two assets on the same chart, which is useful for correlation analysis.
Market screeners and alerts
The screener covers stocks, crypto, forex, futures, and bonds. You can filter by technical conditions, fundamental data, or a combination of both. The alert system supports multi-condition logic and webhook functionality, which means TradingView can trigger automated notifications to external tools or trading bots. That capability goes beyond what most comparable screeners offer.
Economic calendar and news integration
A built-in economic calendar shows scheduled macro events like Federal Reserve announcements, GDP releases, and earnings dates directly on your chart timeline. The news feed pulls real-time headlines for any asset you are watching. Both features reduce the need to switch between tabs while you are analyzing a trade.
Pro Tip: Use the screener to build a shortlist of assets that meet your technical criteria, then open each one in a separate chart tab. This keeps your analysis focused and prevents you from chasing random setups.
How does TradingView’s pricing model work?
TradingView operates on a freemium model. The free Basic plan gives you one chart layout, up to three indicators per chart, and access to most core features with ads. It is genuinely useful for beginners and casual traders. The limitations become noticeable once you start building more complex setups.
Paid plans range from approximately $14.95 to $56.49 per month, covering Plus, Premium, and Ultimate tiers. Each step up adds more chart layouts, more indicators per chart, faster data refresh rates, and removes ads. The Ultimate plan also includes priority customer support and additional server-side alerts.
| Plan | Key benefit | Best for |
|---|---|---|
| Basic (Free) | Core charting, 3 indicators per chart | Beginners testing the platform |
| Plus (~$14.95/mo) | More layouts, 5 indicators, no ads | Active retail traders |
| Premium (~$29.95/mo) | 25 indicators, intraday data, more alerts | Serious traders with complex setups |
| Ultimate (~$56.49/mo) | All features, priority support, max alerts | Professional and high-frequency traders |
TradingView’s multi-device accessibility means your charts, watchlists, and alerts sync across web, desktop app, and mobile. You set up your analysis once and access it anywhere. For retail traders who monitor markets on the go, that consistency matters more than most people realize.
Pro Tip: Annual billing typically reduces the monthly cost by 40% to 60% compared to month-to-month pricing. If you plan to use TradingView for more than three months, the annual plan pays for itself quickly.
What practical ways do traders use TradingView to improve their strategies?
Knowing the features is one thing. Knowing how traders actually use them is where the real value lives. Here are the most common and effective applications:
- Trend identification and entry timing. Traders layer moving averages, RSI, and MACD onto price charts to identify trend direction and spot high-probability entry and exit zones. The multi-timeframe view lets you confirm a signal on a higher timeframe before acting on a lower one.
- Strategy backtesting with Pine Script. You can write or import a Pine Script strategy, apply it to historical data, and see the win rate, drawdown, and profit factor directly on the chart. This is one of the fastest ways to validate an idea before risking real capital.
- Social idea sharing and community learning. TradingView combines advanced charting with an active community of over 100 million traders sharing published ideas, annotated charts, and custom scripts. Following experienced traders on the platform exposes you to analysis styles and setups you would not encounter on your own.
- Broker integration for live execution. TradingView connects directly with brokers including Interactive Brokers, Alpaca, and several forex and crypto exchanges. You can place, modify, and close trades from the chart interface without switching platforms.
- Watchlist management. Watchlists can be color-coded and imported via .txt files, which saves significant setup time when you are tracking dozens of assets. Color coding by sector or trade status gives you a visual snapshot of your portfolio at a glance.
The combination of analysis, backtesting, community input, and execution in one place is what makes TradingView a genuine workflow tool rather than just a chart viewer.
What are common challenges and expert tips for maximizing TradingView?
TradingView’s depth is its greatest strength and its most common trap. The platform offers so many indicators, scripts, and settings that beginners often build charts that look impressive but produce no clear trading signal. Successful traders focus on a few indicators aligned with their trading style to avoid analysis paralysis. Three well-chosen indicators beat fifteen conflicting ones every time.
Chart clutter is a related problem. When you add multiple drawings, trend lines, and zones to a chart over time, it becomes difficult to edit or remove individual elements without accidentally moving others. The Object Tree feature solves this by giving you a layer-by-layer view of every drawing on your chart, similar to how Photoshop manages layers. You can lock, hide, or delete specific elements without touching anything else. Most beginners never discover this feature, and it saves hours of frustration.
On execution, many professional traders use TradingView for analysis but execute trades on their broker’s native platform for better order management. TradingView’s broker integration is convenient, but advanced order types like bracket orders, trailing stops, and conditional entries are often more reliable in a dedicated broker interface. Knowing this distinction helps you build a workflow that uses each tool for what it does best.
Pro Tip: Set alerts based on price levels or indicator conditions rather than watching charts in real time. TradingView’s webhook alerts can notify you via Telegram, Discord, or a custom endpoint, so you stay informed without screen fatigue.
The social community deserves a specific caution. Published ideas on TradingView range from genuinely insightful analysis to low-effort posts with no logical basis. Filter by authors with a verified track record, look at their historical idea accuracy, and treat community content as input rather than instruction.
Key takeaways
TradingView is the most accessible professional charting platform available to retail traders, and using it well requires choosing fewer tools with greater intention.
| Point | Details |
|---|---|
| Platform definition | TradingView is a web-based charting and social trading platform with over 60 million users. |
| Feature depth | Over 400 built-in indicators and 100,000+ Pine Script community scripts cover nearly every analysis need. |
| Pricing structure | Plans range from free to $56.49/month, with annual billing cutting costs by up to 60%. |
| Practical use | Traders use TradingView for trend analysis, backtesting, community learning, and broker-connected execution. |
| Key pitfall | Indicator overload is the most common beginner mistake. Focus on three to five indicators that match your strategy. |
Why TradingView changed what retail traders expect from a charting platform
I have watched retail traders go from using basic broker charts to building multi-panel TradingView setups with custom Pine Script indicators, and the shift in confidence is real. What TradingView did was take tools that previously required a Bloomberg terminal or expensive desktop software and put them in a browser tab. That is not a small thing.
The part most people underestimate is the social network dimension. When you can follow a trader who has published 200 annotated ideas with a documented accuracy rate, you are getting a form of mentorship that did not exist for retail traders ten years ago. The quality varies, but the best contributors on TradingView are genuinely worth following.
My honest caution is this: TradingView can become a procrastination tool disguised as productivity. Spending three hours perfecting a chart layout is not the same as having a trading plan. The platform rewards you for engaging with it, but engagement is not analysis. Use it with a specific question in mind. “Is this asset in an uptrend on the daily chart?” beats “let me see what this looks like.”
For beginners, I recommend starting with the free plan, learning three indicators well, and only upgrading when the plan limitations actually block your workflow. For intermediate traders, the Premium plan hits the right balance of features and cost. Pine Script is worth learning eventually, but master the basics of reading price action first.
— Big
How Bigmovealgo makes TradingView even more powerful
TradingView gives you the charting environment. Bigmovealgo gives you the signal layer on top of it.
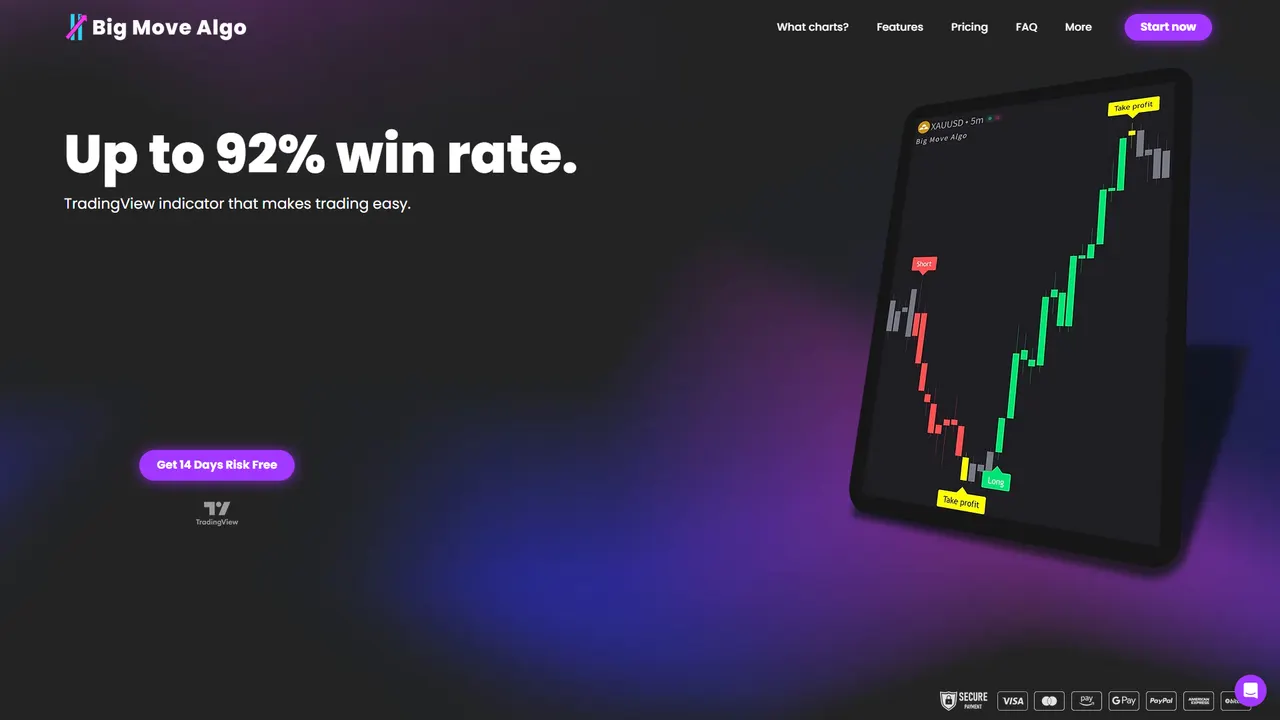
Big Move Algo is a proprietary TradingView indicator that delivers real-time Long, Short, and Exit signals directly on your chart, with a documented win rate of up to 92%. It runs inside TradingView, so you keep the platform you already know while removing the guesswork from signal interpretation. The built-in Fake Trend Detector filters out low-quality setups before they reach you. AUTO Mode gets you trading in minutes with minimal configuration, and Manual Mode gives experienced traders full control. Flexible pricing plans are available for every budget, with instant access after purchase through Stripe. If you want to use TradingView more decisively, Bigmovealgo is the logical next step.
FAQ
What is TradingView used for?
TradingView is used for technical analysis, market screening, strategy backtesting, and live trade execution across stocks, forex, crypto, indices, and futures. It also functions as a social platform where traders share ideas and custom indicators.
Is TradingView free to use?
TradingView offers a free Basic plan with core charting features and up to three indicators per chart. Paid plans starting at approximately $14.95 per month unlock more layouts, indicators, and advanced alert options.
What is Pine Script in TradingView?
Pine Script is TradingView’s proprietary scripting language used to create custom indicators and strategy backtests. The platform hosts over 100,000 community-created Pine Script scripts that any user can access and apply to their charts.
Can you trade directly on TradingView?
TradingView supports direct trade execution through broker integrations including Interactive Brokers and Alpaca. Many professional traders still prefer to execute on their broker’s native platform for access to more advanced order types.
How many indicators can you use on TradingView for free?
The free Basic plan allows up to three indicators per chart. Upgrading to Plus, Premium, or Ultimate increases that limit to 5, 25, or more indicators per chart respectively.