Broker Execution Speed for Retail Traders: Test Fills, Not Ping

Execution speed is the end-to-end time between placing an order and getting a confirmed fill, usually measured in milliseconds. For most active retail traders, the priority isn’t shaving microseconds off a race against institutional desks: it’s consistency, reliable price improvement, and low slippage, which you can verify yourself with the testing steps below.
TL;DR:
- Compare median and 99th percentile fill times, not just averages; the upper tail shows delays during volatile markets that averages can hide.
- A slightly slower fill may cost less overall when it delivers price improvement; assess effective spreads, fill rates, and slippage alongside latency.
- FINRA reports that most held market orders in NMS stocks execute within 500 milliseconds, but volatility, liquidity, and order type affect individual results.
- Test dozens to hundreds of orders across instruments and market sessions, recording fill time, slippage, and completion; compare median and worst case results.
- Ping measures only network round trip, while alert delivery precedes order placement; neither alone captures broker processing, routing, and confirmed fills.
Table of Contents
- What “execution speed” means and the metrics worth reading
- Why execution speed matters for your trading outcomes
- What actually determines a broker’s execution latency
- Execution quality versus raw speed: price improvement, slippage, and fill rates
- Where to find objective execution data on brokers
- A repeatable test protocol for measuring broker execution speed
- What our TradingView alert-latency tests show traders
- A trader’s routine for keeping execution risk low
- Pairing execution testing with reliable signal delivery
- FAQ
- Sources
What “execution speed” means and the metrics worth reading
Execution speed sounds like a single number, but brokers and regulators report it as a distribution. When you read a report or run your own test, three statistics matter: the average (the typical fill time), the median (the middle value, less skewed by outliers), and the 99th percentile (how bad your worst fills get). A broker with a fast average but a terrible 99th percentile will burn you during volatile moves, which is exactly when speed matters most.
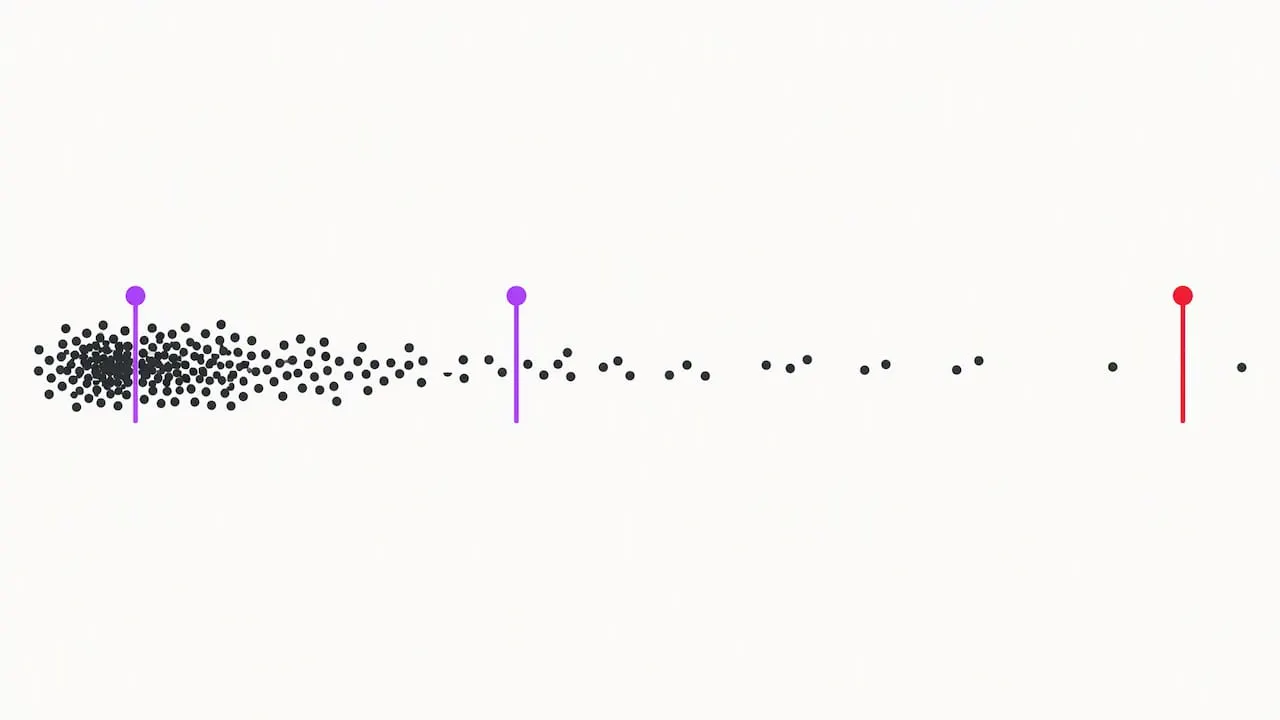
It also helps to separate two things traders often lump together: network ping and end-to-end execution latency. Ping only tells you how long it takes a packet to reach a server and come back. It says nothing about what happens once your order arrives: risk checks, routing decisions, queuing, and the exchange’s own matching engine all add time that ping never captures.
Regulators define a “held market order” as one the broker must execute promptly without discretion over timing or price, which is the benchmark most timeliness reports are built around.
- Average and median show typical performance under normal conditions.
- 99th percentile reveals how execution degrades during stress or high volume.
- Ping/network latency measures only the round trip to a server, not order processing.
- End-to-end latency includes internal risk checks, routing, venue matching, and fill confirmation.
Why execution speed matters for your trading outcomes
Latency becomes visible exactly when you can least afford it: during a fast-moving breakout, a news spike, or a thin overnight session. A held market order that fills in 80 milliseconds during a calm market might take several times longer when volume surges, and that gap is where slippage shows up. If the price moves against you between order entry and fill, you get a worse price than you expected, and the faster the market moves, the more that delay costs.
That said, the relationship between speed and outcome has diminishing returns well before you reach institutional territory. Research on high-frequency infrastructure has found that microsecond-level co-location setups deliver diminishing returns for most retail-style strategies, where consistency and predictable slippage matter far more than shaving microseconds. A retail swing trader holding a position for days gains essentially nothing from a data center next to an exchange matching engine.
Most held market orders in NMS stocks are executed within 500 milliseconds of being received, which gives you a practical benchmark: if your broker’s typical fills run meaningfully slower than that, you have a legitimate reason to investigate further. Faster latency is worth paying for mainly if you scalp, trade around scheduled news releases, or run strategies where a few hundred milliseconds of adverse movement regularly erodes your edge.
What actually determines a broker’s execution latency
Before you can test or compare brokers, it helps to know what’s happening behind the scenes between your click and your fill. Several layers stack up, and each one adds or removes time.
Routing choices come first. Some brokers route orders to internalizing market makers or wholesalers, others use smart order routers that scan multiple venues for the best combination of price and speed. Internalization can be fast, but FINRA guidance on order routing notes that firms internalizing flow still must conduct regular reviews of execution quality and disclose their routing arrangements, since internalized fills aren’t automatically the best available.
Connectivity and infrastructure matter next: direct market access, co-location near an exchange’s servers, and the raw speed of the matching engine itself all shape the floor on how fast a fill can happen. A retail broker running on shared, general-purpose infrastructure will show more variance than one with dedicated, low-latency connections to major venues.
Finally, order handling inside the brokerage adds its own delay. Before your order ever reaches a venue, it typically passes through:
- Risk and compliance checks that confirm you have sufficient buying power or margin.
- Queuing logic that batches or sequences orders during high-volume periods.
- Order-type handling, where fractional shares, odd lots, or complex order types often take an extra processing step.
Pro Tip: Ask your broker’s support team directly what percentage of their internal processing time (versus venue matching time) makes up a typical fill, since few platforms volunteer that breakdown unprompted.
Execution quality versus raw speed: price improvement, slippage, and fill rates
Speed alone tells you only part of the story. The SEC’s guidance on trade execution frames “best execution” as a balance of price improvement, speed, likelihood of execution, and transaction costs, not speed in isolation. A broker that fills you a fraction of a second slower but at a better price has arguably done a better job for you than one that’s marginally faster but fills at the quoted price with no improvement.
Price improvement is the difference between the price you actually get and the best quoted price at the moment you placed your order. Effective spread, sometimes called realized spread, measures the actual cost of a trade relative to the midpoint of the bid-ask spread at execution. Brokers that route heavily for price improvement often show slightly higher average execution times but better realized costs, which is a trade-off worth understanding rather than dismissing.
When you read a broker’s execution-quality disclosure, look past the headline speed number:
- Price improvement rate: what percentage of orders receive a better price than quoted.
- Average price improvement per share: the dollar value of that improvement.
- Fill rate: how often orders execute completely versus partially or not at all.
- Effective spread versus quoted spread: a narrower gap suggests better overall execution quality.
As the SEC itself notes, price improvement can be more valuable than raw latency for retail traders. Consistent fills near the midpoint will usually beat marginally faster fills at a worse price over time.
Where to find objective execution data on brokers
You don’t have to take any broker’s marketing claims at face value. Several public, regulator-mandated reports exist specifically so traders can compare execution quality across firms.
Rule 605 requires market centers to publish standardized monthly reports on execution quality, covering price improvement, effective spread, and speed of execution for different order sizes and types. Rule 606 requires brokers to disclose where they route your orders and their financial relationships with those venues, including payment for order flow arrangements. The SEC’s 2025 amendments to these disclosure rules require more granular reporting, including average, median, and 99th-percentile execution times measured in milliseconds, along with expanded reporting scope for additional order types and broker categories.
FINRA publishes its own Market Order Timeliness Statistical Report, which tracks how quickly held market orders in NMS stocks get executed across the industry. FINRA’s own guidance has also noted that industry execution times have trended downward over recent years, suggesting firms should periodically revisit what counts as a reasonable timeliness threshold.
| Report | What it shows | Published by |
|---|---|---|
| Rule 605 report | Price improvement, effective spread, execution speed by order type | Market centers, monthly |
| Rule 606 report | Order routing destinations and payment for order flow disclosures | Brokers, quarterly |
| Market Order Timeliness Statistical Report | Percentage of held market orders executed within set time thresholds | FINRA |
A few caveats apply when reading these reports. Smaller brokers or certain order types may fall under exemptions that reduce reporting granularity, and account-level thresholds mean not every retail account’s orders are reflected identically in aggregate statistics. Treat these reports as a strong starting point for comparison, not a guarantee of what any single order will experience.
A repeatable test protocol for measuring broker execution speed
Public reports tell you how a broker performs in aggregate. Running your own test tells you how it performs for your specific strategy, instrument, and order type. Here’s a compact protocol you can run yourself.
- Choose your test parameters: pick one or two order types you actually use (market, limit, or marketable limit), a handful of instruments across different liquidity levels, and multiple times of day, including market open, midday, and close.
- Set a sample size: aim for several dozen to a few hundred orders per instrument spread across different sessions, since small samples produce misleading variance that one lucky or unlucky fill can distort.
- Pick your measurement tools: a basic ping test for network latency, a VPS near your broker’s servers if you trade from a slow connection, and, if you use TradingView alerts, a separate measurement of alert delivery time.
- Test both access paths: if your broker offers both an API and a web or desktop platform, time both, since API execution is often materially faster than manual order entry through a UI.
- Record three things per order: time from order submission to confirmed fill, the difference between expected and realized price (your slippage), and whether the order filled completely, partially, or not at all.
- Analyze the distribution, not just the average: calculate your own median and worst-case (90th or 99th percentile) times, then compare them against the FINRA benchmark of 500 milliseconds for held market orders.
Pro Tip: Run your test during both a calm session and a known high-volatility window, such as a major economic release, since execution speed that looks fine on a quiet Tuesday afternoon can fall apart during a volume spike.
What our TradingView alert-latency tests show traders
We’ve run our own synthetic measurements on a specific piece of this puzzle: how long it takes for a TradingView alert to actually reach a trader after a signal fires. Our testing found a median alert delivery time of 4.0 seconds across the conditions we measured, and we’ve documented the methodology, including sample sizes in the 30 to 50 range per test run, in a separate guide on arranging synthetic latency tests.
It’s worth being precise about what this number does and doesn’t measure. Alert latency is the time between a signal condition being met on a chart and that alert reaching you, whether by app notification, email, or webhook. It is a separate layer from exchange matching latency, which is the time your broker and the exchange take to actually fill an order once you act on that alert. Confusing the two is a common mistake: a trader might blame a broker for a “slow” execution when the actual delay happened upstream, in signal delivery, before the order was ever placed.
That distinction is exactly why a complete picture requires triangulating three separate measurements rather than relying on any single number:
- Signal or alert latency: how long it takes a trading signal to reach you after it fires.
- Network latency (ping): the round-trip time between your connection and your broker’s servers.
- End-to-end execution latency: the full path from order submission through broker processing to confirmed fill.
Traders often treat ping as a stand-in for full execution speed, but the end-to-end path includes internal risk checks, routing logic, venue matching, and fill confirmation, none of which a simple ping test captures. If you’re trading off automated or semi-automated signals, measuring your own alert delivery time alongside your broker’s execution statistics gives you a far more complete diagnostic than looking at either number alone. Partner research on execution scoring has made a similar point in a different context: forensic analysis of execution gaps often matters more than any single headline metric, since the gap between claimed and actual performance tends to hide in the details rather than the summary number.
A trader’s routine for keeping execution risk low
I retest execution speed quarterly, or immediately after a broker changes its platform, routing partners, or pricing structure. A single bad fill during a news spike isn’t a reason to switch; a pattern across dozens of orders is.
My go/no-go checklist before switching brokers: your median fill time sits noticeably above the FINRA 500-millisecond benchmark for your order type, your realized slippage consistently exceeds what the broker’s own Rule 605 disclosures would predict, or your fill rate on marketable orders drops below what you’d consider acceptable for your strategy.
Automate what you can: scripted order logs, a standing spreadsheet template for recording time-to-fill and slippage, and a recurring calendar reminder to pull the latest Rule 605/606 reports keep this from becoming a one-time exercise you never repeat.
— Steven Hartwell
Pairing execution testing with reliable signal delivery
Testing your broker’s execution speed only solves half the equation if the signals triggering your trades are themselves slow or unreliable. That’s the problem our TradingView indicator is built to address: clear Long, Short, and Exit signals delivered through AUTO Mode with minimal setup, so you spend less time second-guessing when and whether to act.
Our built-in Fake Trend Detector filters out low-quality market conditions before a signal ever reaches you, which matters just as much as broker latency when you’re trying to catch a real move instead of chasing noise. Since signal delivery and broker execution are separate links in the same chain, as we covered above, pairing a tested broker with instant, structured alerts gives you a tighter overall setup across crypto, forex, stocks, indices, and commodities. Our plans include Version 2, Version 3, and Version 3 Plus at various subscription levels. For current pricing details, please see the pricing page. Check the full plans and pricing to find the version that fits your trading style, or visit Big Move Algo to get instant access after signup.
This article is general information, not a substitute for advice from a qualified financial advisor. Consult a qualified financial professional about your own circumstances before acting on anything here.
FAQ
What is execution speed in trading?
Execution speed is the time between submitting an order and receiving a confirmed fill, typically measured in milliseconds. It includes broker-side processing, order routing, and the exchange’s matching engine, not just the network time it takes your order to reach a server.
How long does it take for a trade to be executed?
Most held market orders in NMS stocks are executed within 500 milliseconds of being received, according to FINRA’s timeliness reporting. Actual time varies by order type, instrument liquidity, and market volatility, with execution typically slowing during high-volume periods.
What is the 3-5-7 rule in trading?
Definitions vary slightly between traders who reference it, so treat it as a general risk-sizing framework rather than a fixed rule with one official source.
How did one trader make $2.4 million in 28 minutes?
We don’t have a verified, sourced account of this specific claim, so we can’t confirm the details or methodology behind it. Large, fast gains like this are typically tied to concentrated leverage or highly volatile instruments, which also carry correspondingly large downside risk.