
Confirm Signals With 1.5× Volume: 5 Step Trader Checklist to Automate

Volume should confirm a signal whenever you’re trading a breakout, a trend continuation, or a reversal attempt, and the bar to clear is concrete: look for volume at or above 1.5 times the 20-period average, with 2 times signaling real conviction and 3 to 5 times flagging climactic, exhaustion-prone moves. Skip the volume check only on low-stakes scalps where you’re already sized small. You can use tools that apply these filters automatically so you’re not eyeballing volume bars mid-trade.
TL;DR:
Volume confirmation is strongest when it reaches 1.5 to 2 times the 20-period average, with 3 to 5 times indicating climactic moves, especially during breakouts.
Divergence signals require three to five swings to be reliable, and news-driven volume spikes should be waited out for 30 to 60 minutes before acting.
High volume above VWAP suggests buyer control, while volume below indicates seller dominance; absorption involves high volume with little price movement before a breakout.
Using automated tools to test volume thresholds and multi-timeframe validation improves accuracy and reduces manual error during trade entry decisions.
Traders should prioritize structure and multi-timeframe alignment before considering volume, avoiding over-reliance on precise RVOL ratios alone.
Table of Contents
How Do You Confirm Trading Signals With Volume?
Five volume patterns do most of the work when you’re deciding whether a signal is real or a trap. Each one measures a slightly different thing, and knowing which to check depends on where price is in its move.
Breakout volume is the most common check. Compare the volume on the breakout bar to the 20-period volume moving average. A reading of 1.5 times that average is the baseline threshold for a breakout worth taking seriously; 2 times or more suggests institutional-size participation, not just retail chasing. The follow-through matters too. A breakout that spikes volume for one bar and then dries up on the next two or three is far weaker than one where volume stays elevated through the retest.
Volume divergence shows up when price pushes to a new high or low but volume shrinks on each successive swing. This is a classic warning that the move is running out of fuel, but a single divergent swing means almost nothing. Reliable divergence signals typically need three to five swings in the same direction before you should trust them enough to act.
Climactic or exhaustion volume is the opposite extreme: a spike of 3 to 5 times the average, usually near a multi-week or multi-month high or low. This often marks the point where the last buyers or sellers pile in right before the move reverses. The catch is that news-driven spikes look identical on the chart, so a 4x volume bar during an earnings release or a Fed announcement tells you nothing about exhaustion. Context matters as much as the number.
VWAP context adds a directional layer that raw volume alone can’t give you. High volume printed above the volume-weighted average price generally points to buyers in control; high volume below VWAP points the other way. When heavy volume clusters right at VWAP, that’s a contested level, and you should wait for a clean break rather than guessing which side wins.
Absorption is the pattern most retail traders never learn to spot. It’s heavy volume at a price level with almost no price movement, which means someone large is absorbing every seller (or buyer) without letting the price move. You’ll see it as a tight cluster of high-volume bars that go nowhere, followed by a sharp move once the absorption is finished. If your platform shows time and sales or tape data, you’ll often see unusually large prints stacking at one price right before this happens.
Breakout bar volume ≥ 1.5× the 20-period average, ideally 2× or higher
Divergence needs 3 to 5 confirming swings, not one
Climactic spikes of 3 to 5× average often mark exhaustion, but check for news first
Volume above VWAP favors buyers; below VWAP favors sellers
Absorption shows as high volume with flat price, followed by a breakout
Quick Reference: A breakout bar printing at 150% to 200% of the 20-day average volume shows meaningfully higher follow-through than breakouts on thin volume, according to tiered signal reliability data.
Pro Tip: Don’t just check the breakout bar. Pull up the three bars before it. If volume was already climbing into the trigger bar rather than appearing out of nowhere, that’s a stronger tell than the trigger bar alone.
Which Volume Indicators Should You Use to Measure Confirmation?
Numbers beat impressions. Here’s how to quantify each of the patterns above instead of eyeballing the volume histogram.
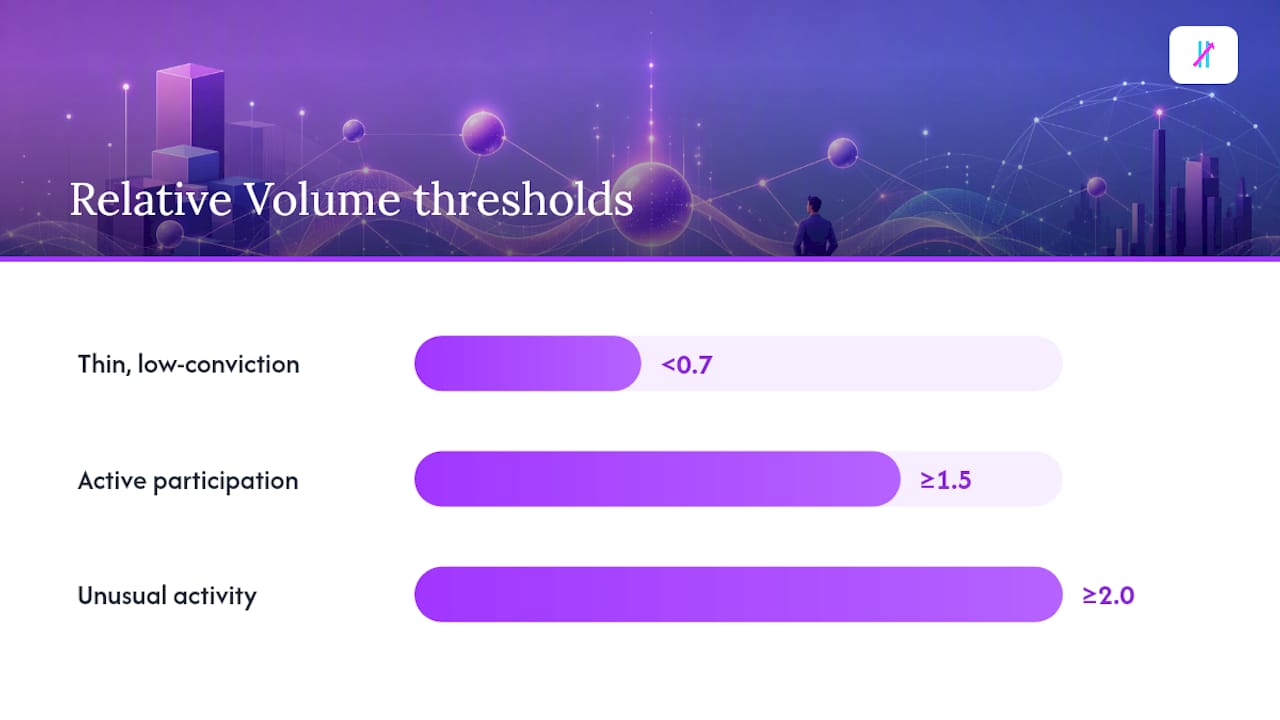
Relative Volume (RVOL) is the cleanest starting point: divide the current bar’s volume by the average volume over the last 20 bars. An RVOL above 1.5 signals active participation, above 2.0 signals unusual activity worth investigating, and below 0.7 signals thin, low-conviction trading you should treat skeptically. Most charting platforms, including TradingView, let you plot this as an overlay so you’re not doing the math by hand.
The 20-period volume moving average itself deserves its own line on your chart. Treat it as your institutional reference point. Once it’s plotted, every breakout or reversal attempt gets measured against the same baseline, which removes a lot of the guesswork that comes from just “the bar looks big.”
Beyond RVOL, a handful of indicators each measure something distinct:
Indicator | What it measures | Signal to watch for |
On-Balance Volume (OBV) | Cumulative volume flow, added or subtracted by price direction | OBV trending with price confirms; OBV flattening while price rises signals divergence |
Money Flow Index (MFI) | Volume-weighted RSI, blends price and volume momentum | Readings signaling overbought or oversold conditions flag with volume backing |
Accumulation/Distribution (A/D) | Where price closes within its daily range, weighted by volume | Rising A/D with rising price confirms; falling A/D on rising price warns of distribution |
Volume Rate of Change (VROC) | Speed of change in volume itself | Sharp VROC spikes often precede or coincide with breakout or climax bars |
VWAP earns a permanent spot on intraday charts because it does double duty. It sets your directional bias for the session, and it gives you a level to watch for retests. When price pulls back to VWAP on declining volume rather than a fresh surge, that’s a healthier retest than one accompanied by a volume spike from the opposing side.
Step-by-Step Checklist to Confirm a Signal With Volume
Run through this sequence before you enter, in order, not as a checklist you glance at after the fact.
Validate the price structure first. Confirm there’s an actual trend, a defined support or resistance level, or a recognizable pattern like an engulfing candle or a pin bar. Volume can’t rescue a setup that has no structure behind it.
Check the trigger bar’s RVOL against the 20-period average. You want 1.5x minimum, with 2x or more giving you more room to size up. If OBV or MFI is trending in the same direction, that’s added weight.
Verify multi-timeframe alignment. Requiring the next-higher timeframe to agree, or at least not conflict, cuts down on false breakouts that look great on a 5-minute chart and fall apart on the hourly.
Read the VWAP context and watch the retest. A retest that shows declining volume on the opposing side is a green light. Rising volume against your position on the retest is a reason to stand aside.
Size down or skip when confirmation fails. If volume doesn’t clear your threshold, if the move coincides with a scheduled news release, or if you’re trading a low-liquidity window, either cut position size meaningfully or don’t take the trade at all.
Pro Tip: Write your RVOL threshold on a sticky note next to your monitor for the first few weeks. Most traders who skip volume confirmation aren’t ignoring the rule on purpose. They just forget to check it once the setup looks exciting.
When Does Volume Mislead You?
Volume is a filter, not an oracle, and it fails in predictable ways.
News-driven spikes are the biggest trap. An earnings surprise or a macro headline can print 4x or 5x average volume in a single bar with zero relationship to accumulation or exhaustion. Give it 30 to 60 minutes of follow-through before trusting a news-driven volume spike as a genuine signal.
Thin markets cause the opposite problem. During pre-market hours, holiday sessions, or after-hours trading, average volume itself is so low that even a modest RVOL reading can look artificially high. Either raise your threshold in these windows or skip trading them entirely.
Forex and some crypto venues complicate things further, since most forex data feeds report tick volume rather than true traded volume, a proxy based on price-change frequency rather than actual contract size. It correlates with real volume reasonably well, but the thresholds you’d use on a stock chart don’t transfer cleanly. Adjust your multipliers downward and, where possible, cross-check against a second data source.
Confirmation bias sneaks in when traders stack indicators that all measure the same underlying thing. Pairing a volume signal with an indicator from a different category, such as a momentum or trend indicator rather than another volume-based one, gives you a real second opinion instead of an echo.
Wait out news-driven volume spikes for 30 to 60 minutes before acting on them
Raise RVOL thresholds or avoid trading during thin, low-liquidity windows
Adapt volume thresholds for forex and tick-volume proxies rather than using stock-market multipliers
Pair volume with a momentum or trend indicator, not another volume tool, to avoid double-counting
How Big Move Algo Applies Volume Confirmation for You
Running this checklist manually on every setup gets tedious fast, which is why some trading indicators include features to filter out setups where volume and price structure don’t line up, reducing the need to manually check RVOL against the 20-period average every time a signal fires.
Signal filters built around volume thresholds can help reduce the chance of acting on a thin, low-conviction breakout
Some indicators offer automatic modes for applying volume checks with minimal setup
Manual modes may be available for adjusting sensitivity and combining with multi-timeframe review
Such tools can work across multiple markets including crypto, forex, stocks, indices, and commodities on TradingView
What you get | Why it matters for volume confirmation |
Fake Trend Detector | Flags conditions where volume doesn’t support the price move |
AUTO / Manual modes | Lets beginners lean on defaults while advanced traders fine-tune thresholds |
Multi-market coverage | Applies the same filtering logic whether you trade stocks or crypto |
What Traders Get Wrong About Volume Confirmation
Most retail traders treat volume as a tiebreaker, something they glance at after they’ve already fallen in love with a chart pattern. That’s backwards. Volume should be a gate you have to clear before the pattern even counts, not a nice-to-have that makes you feel better about a trade you already wanted to take.
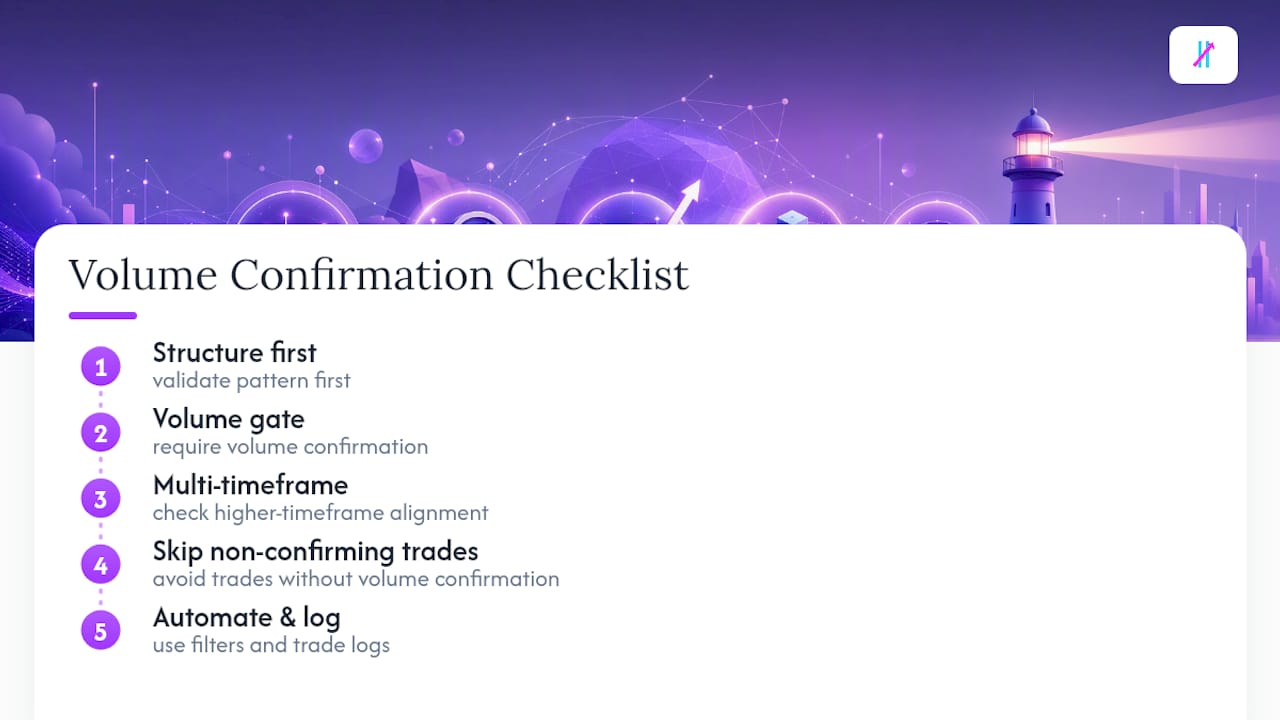
The bigger mistake is chasing precision that doesn’t exist. Traders obsess over whether RVOL is 1.6 or 1.8 while ignoring the far more useful multi-timeframe check, which does more to cut false breakouts than fine-tuning a single ratio ever will. Structure first, then volume, then timeframe alignment. That order matters more than the exact multiplier you settle on.
If you take one thing from this guide, make it the discipline to skip trades when volume doesn’t confirm, even when the setup looks perfect otherwise, by using advanced performance analysis and trade logs. That’s harder than it sounds. It’s also where automated filters, whether you build your own or lean on a tool designed for it, earn their keep by removing the temptation to rationalize a weak signal into a trade.
— Steven Hartwell
Ready to Automate Your Volume Confirmation Checks?
Running the RVOL, VWAP, and multi-timeframe checks in this guide by hand on every setup is where most traders lose discipline, usually right when a chart looks too good to skip. Big Move Algo builds those checks into the signal itself, so the Long, Short, and Exit calls you see on your TradingView chart already account for volume conditions through the Fake Trend Detector, rather than asking you to run a separate mental checklist under pressure.

If you already use TradingView, setup takes minutes. AUTO Mode gets you filtered signals with almost no configuration, while Manual Mode lets you adjust sensitivity if you want tighter control over thresholds. It covers crypto, forex, stocks, indices, and commodities, so you’re not switching tools between markets. For readers who want the mechanics of confirming a signal independently first, this guide to verifying a trading signal walks through the same logic in more depth. When you’re ready to connect the indicator to your own chart, you can manage your TradingView account access and start applying these filters on your next session.
Sources
Recommended
Comments