
Avoid False Breakouts: Trend Strength Rules for Traders (ADX Above 25)

A trend strength indicator measures how consistently price is moving in one direction rather than chopping sideways, and its best use is as a filter, not a trigger. Traders use it to decide whether the market is even worth trading directionally before they look at entries. Treat a single reading as a hint, not a verdict. Higher-confidence signals come from stacking a trend-strength read with breadth or momentum confirmation.
TL;DR:
Trend strength indicators should be used as filters with confirmation from breadth or momentum signals to improve reliability.
Different indicators measure distinct aspects: ADX gauges trend regime, TSI reflects momentum, and composite scores fuse multiple inputs for a comprehensive view.
Setting lookback lengths matching your trading horizon and normalizing readings by ATR enhances accuracy across different assets and timeframes.
Combining regime filters with price structure, breadth, and volume checks reduces false signals and guides better position sizing and exits.
Automated tools like Big Move Algo can streamline the workflow, automatically filtering low-quality setups and confirming signals in real time.
Table of Contents
How Trend Strength Indicators Work
Most trend strength indicators fall into two camps: correlation-based and momentum-based. The Trend Strength Index on TradingView uses a Pearson-correlation approach, measuring how closely closing prices track a straight, rising or falling line over a lookback window. A reading near +1 means price has moved up in an almost straight line. Near -1 means a clean downtrend. Near 0 means price is drifting with no consistent direction.
Momentum-based tools, like rate-of-change oscillators, measure speed instead of consistency. Composite gauges blend several of these dimensions into a single 0 to 100 score, where bands above roughly 70 to 80 suggest a trending regime and bands near 40 to 60 suggest indecision.
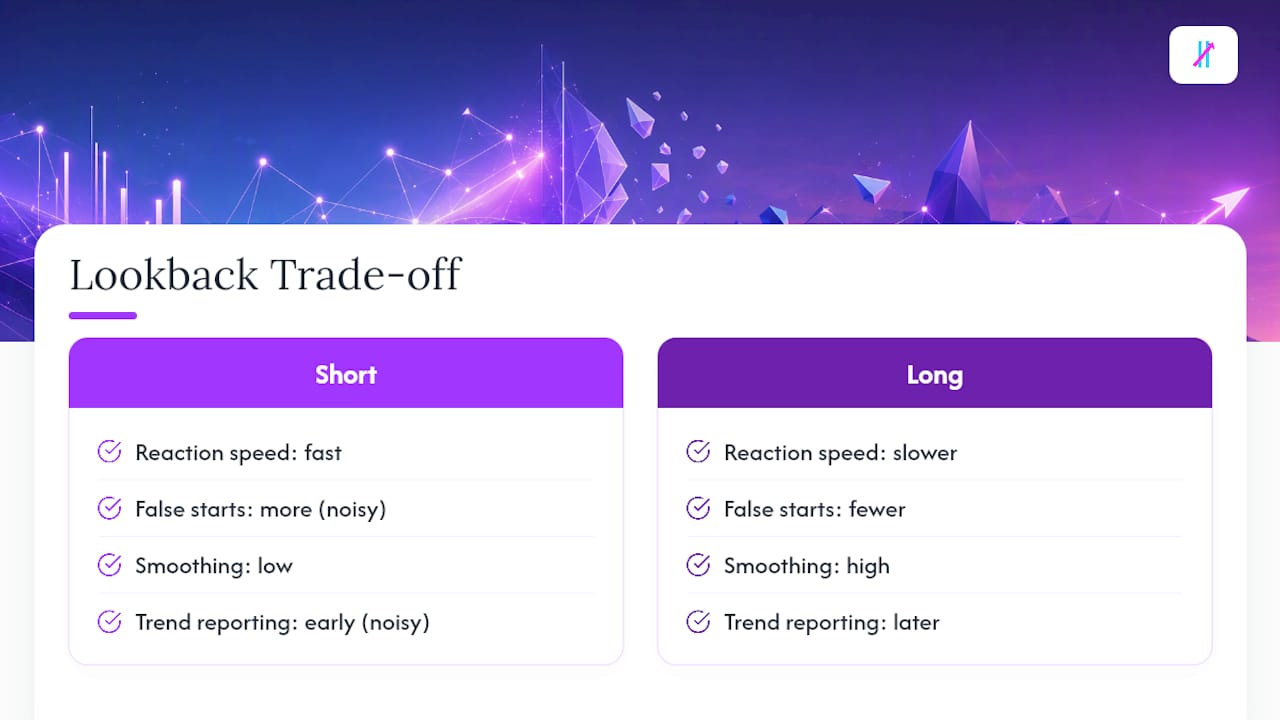
Lookback length controls the trade-off directly: a short lookback reacts fast but produces more false starts, a long one smooths noise but reports the trend late.
Common Trend-Strength Indicators And What Each One Tells You
Every trend strength indicator answers a slightly different question, and mixing them up is where most traders get burned. Here’s what each one actually measures:
Average Directional Index (ADX): Measures the strength of a directional move regardless of whether it’s up or down. Readings below 20 usually mean a rangebound market, 20 to 25 marks the beginning of a trend, and above 40 signals a strong, often mature trend. ADX works best as a regime filter that tells you whether trend-following tactics make sense at all.
True Strength Index (TSI): A momentum indicator built on double-smoothed price changes, typically paired with a signal line for crossover reads. Unlike RSI, which oscillates on relative gains and losses over a fixed period, TSI smooths twice, which cuts down on the jagged whipsaws RSI is prone to in choppy markets. Readings pushing toward the extremes of its range (often discussed as approaching ±1 on normalized scales) suggest a stretched, high-conviction move.
Rate of Change (ROC) and momentum oscillators: These measure the speed of price change rather than its consistency. They’re useful for timing entries once a trend is already confirmed by something like ADX, but on their own they generate a lot of noise near the zero line.
Moving average alignment and slope: When shorter-term averages stack cleanly above longer-term ones, and the slope of the longer average is rising, that’s structural confirmation of trend, not just a momentum blip.
Composite gauges (Market Condition Gauge, Trend Strength Score): These fuse several of the above, plus inputs like volume ratios and ATR, into one number. Fusion matters because it means one noisy input, say a momentum spike from a news event, doesn’t dominate the read the way it would if you were watching that indicator alone.
The single-indicator pitfall is simple: any one input can be fooled by a gap, a low-volume session, or an earnings surprise. That’s the entire argument for reading two or three signals together instead of trusting one number.
How To Read Values, Choose Inputs, And Match Timeframes
Interpreting a trend strength indicator well means matching its settings to how you actually trade. Here’s a working framework:
Set your lookback to your holding period. Intraday traders generally run shorter lengths, often in the 7 to 14 bar range, for faster reaction. Swing and position traders tend to use 20 to 50 bars, prioritizing reliability over speed.
Apply known threshold rules. ADX crossing above 25 is a common line for “trend regime is active.” A composite score above 80, as used in frameworks like Trend Screener’s Trend Strength Score, marks a strong continuation state, while a drop below 23 flags risk-off conditions.
Normalize with ATR when comparing instruments. A raw price-based reading on a $5 stock and a $500 stock isn’t comparable without volatility normalization.
Require higher-timeframe confirmation. Don’t act on a lower-timeframe momentum cross unless the higher timeframe’s trend-strength read agrees.
Pro Tip: Run your trend strength indicator on the daily chart first, note whether it’s above or below its trending threshold, and only then check your entry timeframe. It takes ten seconds and eliminates a surprising share of bad trades.
Combining Indicators: A Practical Workflow For Entries And Risk
A trend strength indicator earns its keep when it sits inside a sequence, not when it’s used alone to pull the trigger. Here’s a workflow that puts it in the right spot.
Filter the regime first. Check ADX or a composite score before anything else. If it’s below your trending threshold, either skip the trade or switch to a range-trading approach instead of trend-following.
Confirm with structure and momentum. Once the regime passes, look at price structure (higher highs and higher lows, or the reverse) alongside a momentum read like TSI or ROC. Two agreeing signals beat one.
Check participation. Before sizing up, glance at breadth or volume to confirm the move isn’t riding on a handful of names or a thin session.
Size positions to the strength score. A reading deep in trending territory can justify a full position. A borderline reading, hovering near your threshold, calls for a half-size entry or a wider stop to account for the extra noise.
Scale out as the score fades. When the trend-strength reading rolls back below its threshold, or hits a “stretch” extreme that historically precedes reversals, that’s the cue to trim, not to add.
This sequence protects you from the most common failure mode: trading a momentum blip that shows up on a five-minute chart while the underlying trend, on any longer view, is flat or fighting itself.
Why Breadth And Institutional Flow Matter As A Second Opinion
A chart-level trend strength indicator can look strong while the market underneath it is thin. That’s the gap breadth closes.
Advancing versus declining volume tells you whether gains are broad-based or concentrated in a few large names.
New highs versus new lows flags when fewer stocks are participating even as the index climbs.
Passing-stock counts and institutional accumulation/distribution days on dollar volume can show large investors quietly selling into strength.
A rising index paired with shrinking breadth is a classic warning sign. Institutional flow measures tracked by Trend Screener show that distribution stacking over a rolling window often precedes a failed breakout, even while the headline number still looks bullish. Adding a simple benchmark comparison, how many stocks in an index are actually above their own trend threshold, gives you a second opinion the price chart alone can’t provide.
How Big Move Algo Puts These Checks Into Practice
Big Move Algo applies this same regime-first logic inside a single TradingView tool. Its Fake Trend Detector screens out low-quality setups the way a manual breadth check would, flagging conditions where directional strength looks real on the surface but lacks the follow-through to trade. The resulting Long, Short, and Exit signals function as the confirmation layer described above, built to reduce the false starts that come from acting on one indicator alone.
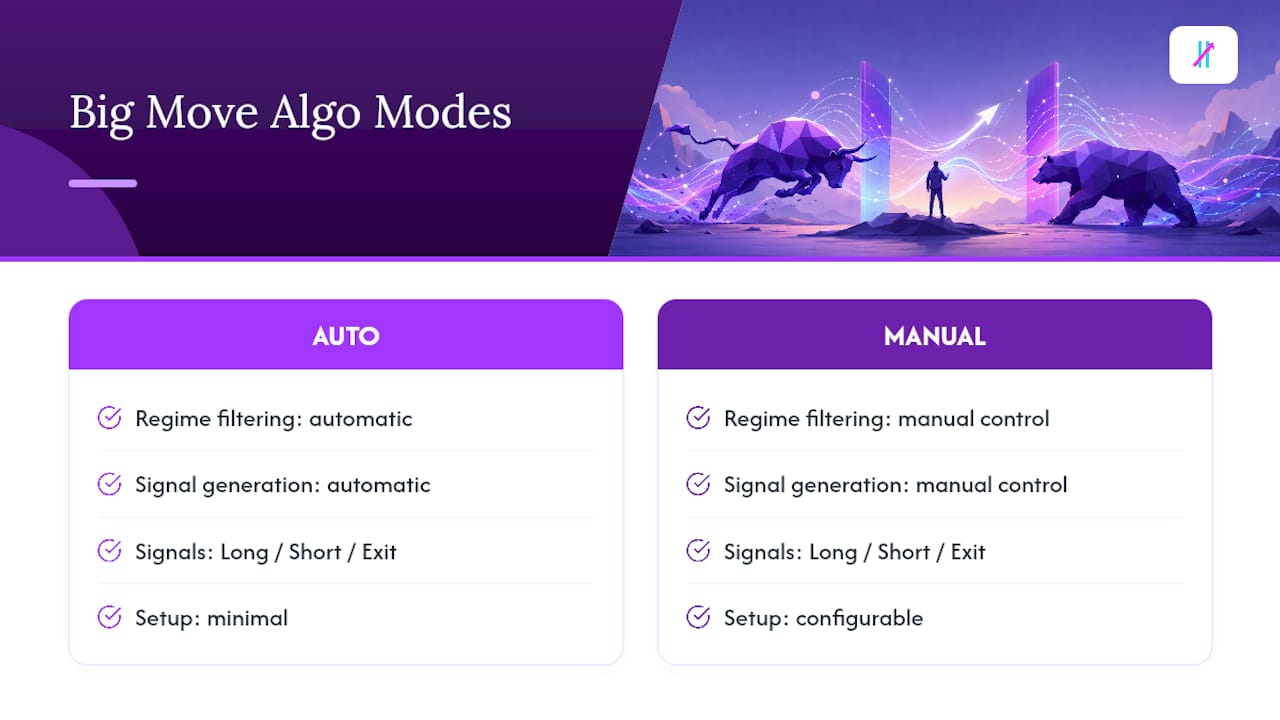
AUTO Mode handles the regime filtering and signal generation with minimal setup, while Manual Mode lets more experienced traders adjust sensitivity across crypto, forex, stocks, and indices. Readers curious about how the mechanics work in practice can review the TradingView indicator categories that inform this kind of implementation.
When Trend-Strength Readings Help Most, And Where They Fall Short
Composite, regime-based readings earn their place when you’re deciding whether to trade a breakout at all. Single indicators fall apart fastest on low-participation days, so pairing timeframe alignment with a breadth check catches most of what one signal misses. Test any rule on history before sizing it up, and never let a strong reading talk you into oversized risk.
— Steven Hartwell
Put The Workflow On Autopilot With Big Move Algo
Reading ADX, TSI, and breadth by hand every session works, but it’s slow, and it’s easy to skip a step when a setup looks exciting. Big Move Algo runs that same regime-first checklist automatically, on the chart, in real time.

The Fake Trend Detector does the job breadth and participation checks do manually, filtering out the low-quality setups this article warns against before you ever risk a position. The Long, Short, and Exit signals then hand you the confirmation layer the workflow above calls for, without requiring you to cross-reference three separate indicators mid-session. AUTO Mode gets you running in minutes; Manual Mode gives experienced traders room to tune sensitivity across crypto, forex, stocks, indices, and commodities from one subscription. If the workflow in this guide makes sense to you, the fastest way to see it in action is to visit the Big Move Algo landing page and try it on your own charts.
Where To Go Deeper
This article is general information, not a substitute for advice from a qualified financial advisor. Consult a qualified financial professional about your own circumstances before acting on anything here.
Sources
Recommended
Comments