
Trade Only When 3 of 4 Signals Agree: Confluence Trading for Traders
- Steven Hartwell

- 7 hours ago
- 8 min read

Confluence trading means entering a trade only when several independent forms of analysis point to the same outcome at the same price. It works because no single indicator, pattern, or level is reliable enough to trade alone, but two or three unrelated signals agreeing at once shifts the odds meaningfully in your favor. The practical move is to build a compact 3+1 framework (trend, location, trigger, and risk) and run it through a pre-trade checklist before you click the button.
TL;DR:
Confluence requires three or more independent signals from different market factors, such as trend, location, trigger, and risk, to increase trade probabilities.
Combining unrelated inputs like higher-timeframe bias, key support levels, and confirmation candles provides more reliable setups than using multiple correlated oscillators.
A score of at least three out of four confluence factors justifies taking a trade, but strict pre-trade rules like stop placement and reward-to-risk ratios remain essential.
Over-reliance on similar indicators or stale levels can produce false confidence, emphasizing the importance of independent confirmation and avoiding confirmation bias.
The 3+1 framework applies across markets but should weigh factors differently depending on whether trading forex, stocks, or commodities for better accuracy.
Table of Contents
What Confluence Looks Like on a Chart
Confluence is when multiple independent technical methods agree on a signal at the same time and place, according to Babypips’ definition of confluence. The word “independent” carries the whole concept. Stack three momentum oscillators like RSI, Stochastic, and MACD and you don’t have three confirmations, you have one idea measured three different ways, since they all react to the same price momentum. Real confluence pulls from categories that don’t share the same math.
Traders typically draw from these input types:
Higher timeframe trend or structure — the daily or 4H trend direction
Horizontal levels — prior swing highs/lows, round numbers, session opens
Fibonacci retracements or extensions — 50% to 61.8% pullback zones
Moving averages — a 50/200 cross or price reacting to a cluster
Momentum or volume — confirming a move rather than predicting it
Session timing — London open, New York overlap
Inter-market signals — dollar index strength against a forex pair, or bond yields against equities
A common example: price pulls back into a prior daily resistance zone that also happens to sit at the 61.8% Fibonacci retracement, and a bullish engulfing candle closes right there. That’s three unrelated inputs agreeing on one spot. Another: price reacts off a cluster of the 50 and 200 moving averages while volume climbs above its 20-period average on the bounce. Neither example depends on the other to be true, which is exactly what makes them worth trusting together.
Building a Simple 3+1 Confluence Framework
A workable framework doesn’t need ten indicators. It needs three to five factors from different domains and one clear rule for when a setup qualifies. Alpha Charts’ framework for high-probability setups recommends this structure, often called the 3+1 model:
Higher-timeframe bias — what’s the daily or weekly chart telling you? Trade with that current, not against it.
Location — is price at a key zone (support/resistance, Fibonacci level, moving-average cluster)? No location, no trade, regardless of how good the trigger looks.
Trigger — a confirmation signal at that location: a rejection candle, a break of a minor structure, a momentum shift.
Risk — position size and stop distance calculated before entry, not after.
The “3” refers to bias, location, and trigger; risk is the “+1” that governs whether the trade is worth taking at all. Three independent confluences tend to strike a workable balance between selectivity and trade frequency. Adding too many factors can shrink your opportunity set drastically on typical retail timeframes.
A simple scoring table keeps this from getting subjective by counting independent factors only. Score one point per independent factor present in the setup:
Set a practical minimum threshold of about three out of four before you take the trade, and log every score in a journal alongside the outcome.
Pro Tip: Before you count a factor, ask whether it would change if you removed a different factor from the setup. If two “confirmations” always move together, you’re not stacking evidence, you’re double-counting one signal.
Turning a Confluence Score Into a Pre-Trade Checklist
A score of 3 out of 4 doesn’t tell your hand when to click. That’s what a written checklist is for, and JournalPlus’s trading rules checklist template makes the case that specific, testable rules cut down on emotional overrides far more than a mental “feels right” approach.
A workable pre-trade checklist covers four things:
Entry criteria: enter only on confirmation candle close, not mid-formation, and only when your confluence score meets threshold
Stop placement: beyond the structure that invalidates the setup (below the swing low, past the rejected level), never a fixed pip count divorced from price action
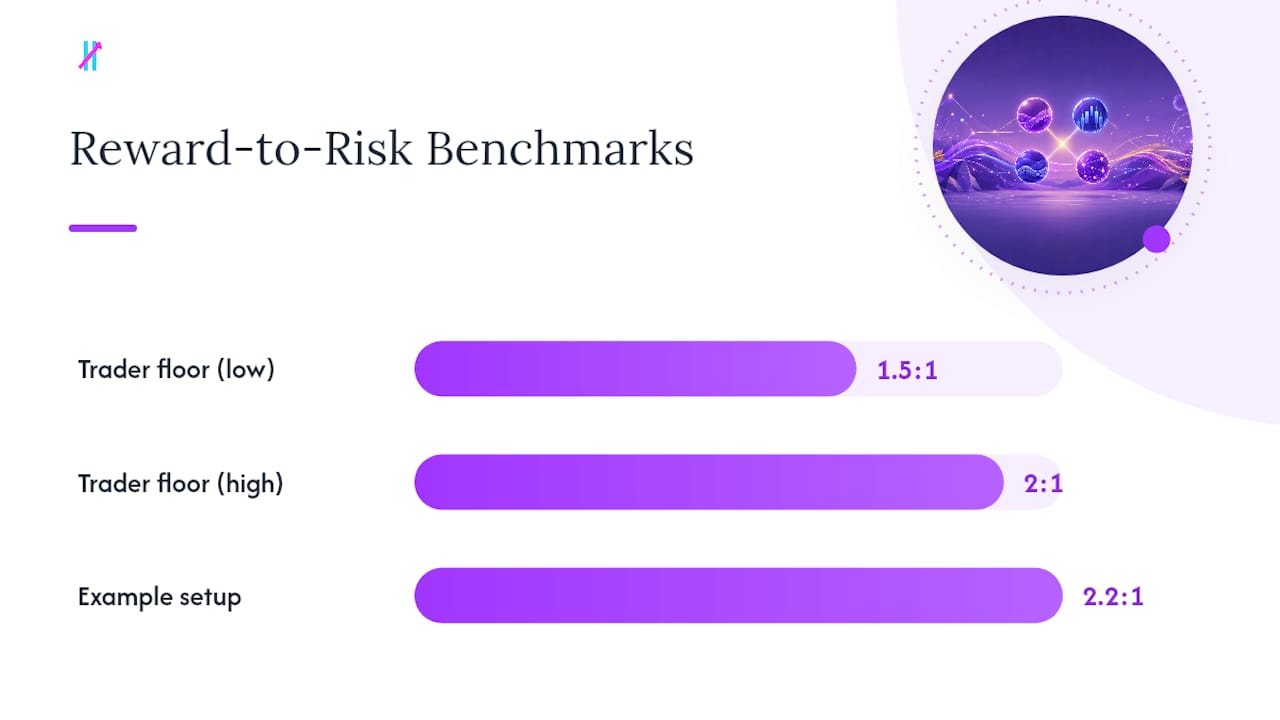
Minimum reward-to-risk: most traders set a 1.5:1 or 2:1 floor before entry; below that, skip the trade even if the score is high
Position size: calculated from stop distance and account risk percentage, decided before you look at potential profit
Here’s how that plays out on one setup. Price pulls into daily support at the 50% Fibonacci retracement (score: bias +1, location +1). A bullish pin bar closes on the 1H chart with volume above average (trigger +1, momentum +1) for a 4-out-of-4 score. Stop goes 10 pips below the pin bar’s low, tied to the structure, not a round number. Target sits at the next resistance shelf, giving a 2.2:1 reward-to-risk. That’s a tradable setup precisely because every rule was decided before entry, not improvised after.
Confluence raises the odds of a trade working, but it never removes risk from the equation, as Investopedia’s overview of confluence in finance points out. Stop placement and position sizing stay mandatory on every single trade, high score or not.
Mistakes That Turn Confluence Into False Confidence
The most common error is counting correlated indicators as separate confirmations. Multiple momentum oscillators often measure the same underlying factor, so they count as one confirmation, not three. Forexpedia’s guidance on confluence specifically warns against treating multiple oscillators as independent evidence when structure, volume, and session timing offer real cross-domain confirmation instead.
Other frequent traps:
Stale levels — a level touched five times already has less predictive power than a fresh one; retire it from your zone list.
Ignoring counter-confluence — a bullish setup sitting directly under major weekly resistance isn’t confluence, it’s a coin flip with extra steps.
Overfitting the framework — adding a sixth or seventh factor to justify a trade you already wanted to take defeats the entire purpose.
Regime matters too. In high-volatility stretches, tighten your threshold to reduce false signals from wider swings. In quiet, low-volatility ranges, you can often relax slightly since fewer false breaks occur. Traders who tag every setup for several dozen trades in a journal tend to be the ones who actually discover which factor combinations produce a real edge, rather than guessing based on the last five trades that happened to work.
Adapting Confluence Rules Across Forex, Stocks, and Commodities
The 3+1 framework travels well across markets, but the inputs that matter most shift depending on what you’re trading. In forex, session timing carries real weight: confluence built around the London/New York overlap behaves differently than the same setup during the Asian session, and inter-market checks like dollar index direction add a layer oscillators alone can’t provide.
In stocks, volume confirmation matters more than in currencies, since equity moves are driven heavily by real order flow, earnings reactions, and sector rotation. A confluence setup on a stock without volume backing it is weaker than the identical setup with volume above its 20-period average.
Commodities like gold and oil respond heavily to macro drivers, so a technical confluence setup that ignores a scheduled inventory report or a central bank decision is incomplete no matter how clean the chart looks. Higher-timeframe bias also carries more weight here, since commodities trend for longer stretches than many forex pairs.
The through-line across all three: keep the 3+1 skeleton, but weight the factor categories to match what actually drives that market. A framework built entirely around forex session timing won’t transfer cleanly to a commodity chart, and vice versa.
Two Real Setups: When Confluence Worked and When It Didn’t
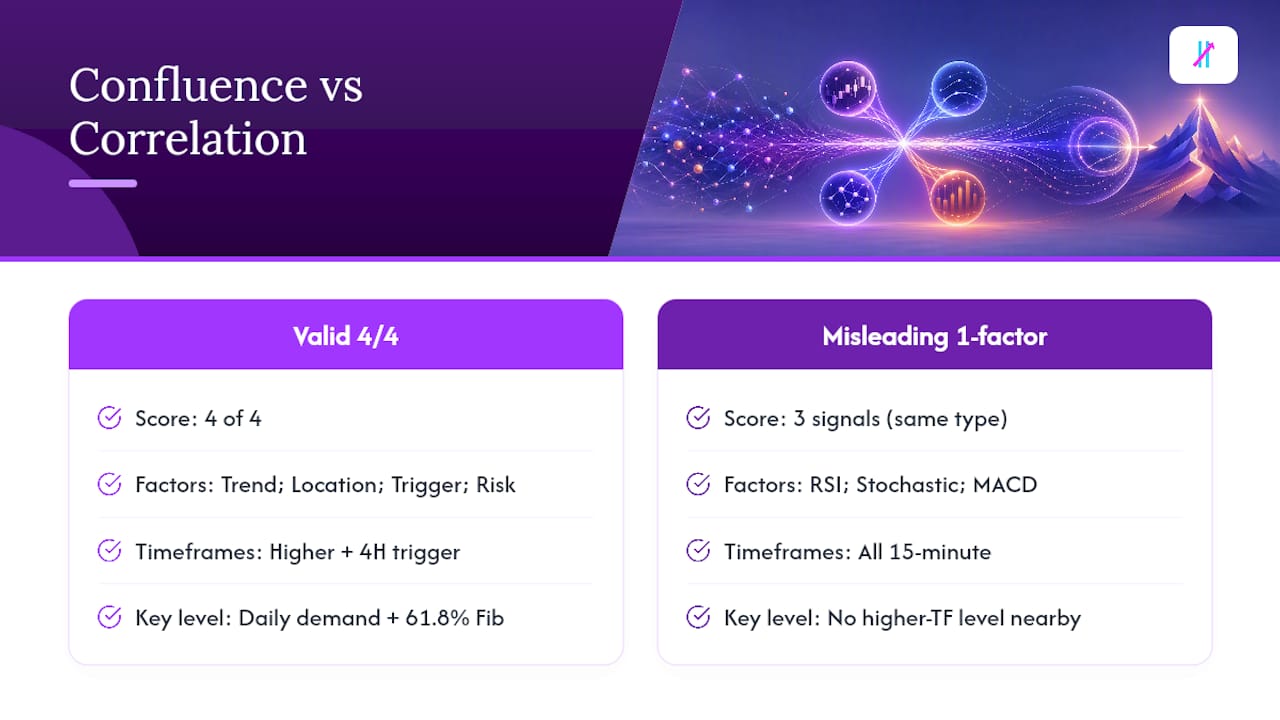
Take a swing setup on a major currency pair pulling back to a daily demand zone that lines up with the 61.8% Fibonacci level. A 4H bullish engulfing candle closes right at that zone, and the higher timeframe trend is still pointing up. Score: 4 out of 4. Stop goes below the demand zone’s low, target sits at the prior swing high, giving roughly a 2:1 reward-to-risk. The trade works because every factor was independent: trend, location, trigger, and a clean risk structure.
Compare that to a setup where a trader takes a long because RSI is oversold, Stochastic is oversold, and MACD is curling up, all on the same 15-minute chart, with no higher-timeframe context and no key level nearby. That’s a 1-factor trade dressed up as three. Price consolidates and rolls over shortly after entry because there was never any real structural confluence, just three flavors of the same momentum reading. The lesson holds regardless of market: a high score built on correlated inputs is worse than a low score built on independent ones, because it manufactures confidence the setup hasn’t earned.
Why This Framework Beats Chasing More Indicators
Many traders add complexity when a setup fails, stacking on more indicators rather than ensuring their existing factors are truly independent. That instinct is backward. The traders who actually improve tend to strip factors out, not add them, until they’re left with three or four that don’t move together and that they can define in one sentence each.
The uncomfortable part of confluence trading is that it disqualifies more setups than it approves. A market that looks busy and full of opportunity will often produce almost nothing that scores 3 or 4 out of 4 on a given week. Traders trained on constant action struggle with that silence more than they struggle with the technical concepts. Big Move Algo’s signal logic reflects this same discipline. Its Fake Trend Detector exists specifically to filter conditions where confluence is weak or contradictory, rather than forcing a signal because the market is moving.
Steven Hartwell covers trading systems and signal design, with a focus on how retail traders can combine indicators for smarter decisions instead of stacking correlated noise. Big Move Algo’s own indicator applies the same logic this guide describes: it evaluates trend, location, and trigger conditions in real time and returns a clear Long, Short, or Exit signal, in AUTO mode for a hands-off read or MANUAL mode for traders who want to adjust the inputs themselves.
— Steven Hartwell
Put the Confluence Checklist to Work
Building and journaling a 3+1 framework by hand takes discipline, and most traders abandon it after a few weeks because tracking every factor manually gets tedious fast. Big Move Algo was built to carry that load. The indicator reads trend, structure, and momentum in real time and returns a direct Long, Short, or Exit signal, with the Fake Trend Detector filtering out the low-quality conditions this guide just spent several sections warning you about.

You still control the checklist: entry rules, stop placement, and position size remain yours to set. What changes is the confirmation step. Instead of manually cross-checking four factors before every entry, AUTO mode does the alignment check for you, while MANUAL mode lets more experienced traders adjust the sensitivity to match their own framework. It runs across crypto, forex, stocks, indices, and commodities, so the same rule set travels with you across markets. Check current access options on the Big Move Algo site and see how the signals line up against your own confluence checklist.
Sources
Recommended
Comments