How Conflicting Indicators Confuse Traders and Cost You
- Steven Hartwell

- Jun 4
- 8 min read
Updated: Jun 5

Conflicting technical indicators are defined as signals from two or more chart tools that simultaneously point in opposite directions, creating a direct contradiction that stalls decision-making. This problem, formally called analysis paralysis in trading psychology, affects traders at every experience level. RSI says overbought. MACD says buy. The Stochastic oscillator sits on the fence. The result is not more information. It is less confidence, slower execution, and missed trades. This guide explains exactly why indicator conflicts happen, what they cost you psychologically, and how to build a chart setup that produces clarity instead of noise.
How conflicting indicators confuse traders at the root level
The core reason indicators conflict is not randomness. It is redundancy. Multiple indicators often create redundancy and contradictory impressions because they respond to the same underlying price data at different speeds. A fast RSI (14-period) and a slow MACD histogram are both momentum tools. They measure the same market force. The only difference is the lag built into each calculation. When price is transitioning between a trend and a consolidation, the fast tool flips first while the slow tool still points the other way. That gap is not new information. It is the same signal arriving twice, slightly out of sync.
This is the concept of indicator correlation, and it is the single most misunderstood issue in retail trading. Correlated indicators provide redundant signals rather than independent confirmations. Combining RSI and Stochastic, for example, is mathematically similar to counting one factor twice. Both are bounded oscillators derived from recent price ranges. Their agreement tells you nothing beyond what either one already told you alone.

Why momentum oscillators are the worst offenders
RSI, Stochastic, and Williams %R are the three most commonly stacked oscillators in retail trading. Multiple momentum oscillators move in tandem roughly 85% of the time, which means requiring their agreement is an artificial hurdle that produces missed opportunities far more often than it prevents bad trades. When they do diverge, the divergence is almost always a timing artifact, not a genuine signal disagreement.
The same problem exists between trend indicators. A 20-period moving average and a 50-period moving average both measure trend direction. Stacking them creates the illusion of confirmation when price sits between them. In reality, you have two answers to the same question, and neither one is more valid than the other.
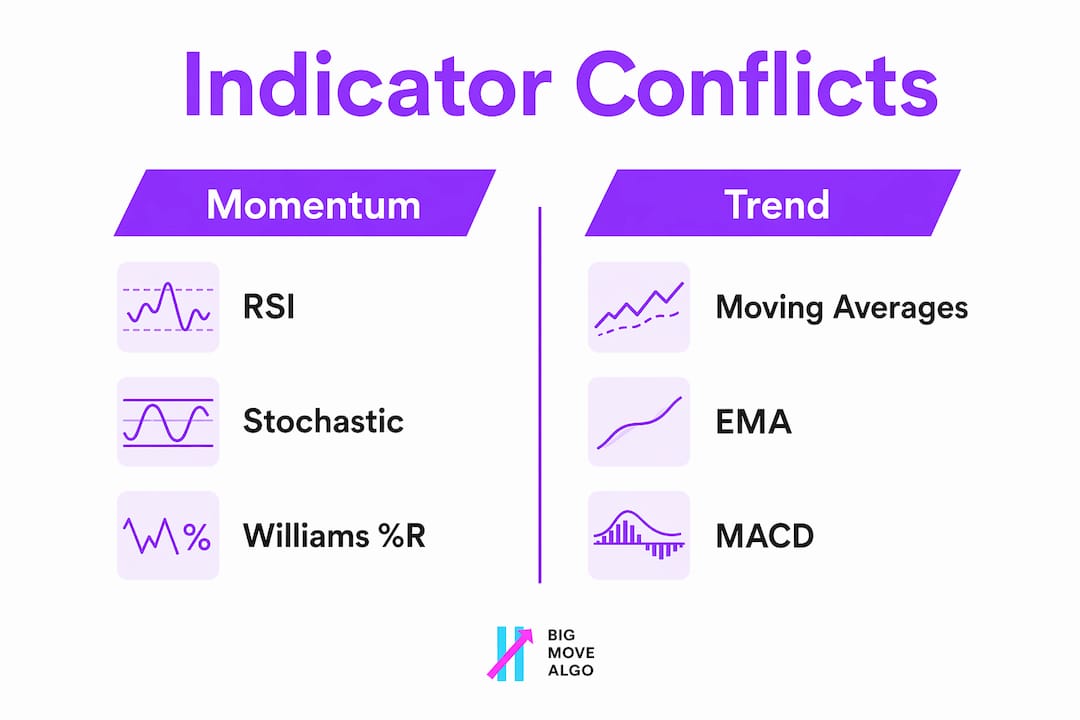
Indicator category | Common examples | What they measure | Conflict risk when combined |
Momentum oscillators | RSI, Stochastic, Williams %R | Rate of price change | Very high (same data, different lag) |
Trend indicators | Moving averages, MACD line | Direction of price | High (same trend, different period) |
Volume indicators | OBV, Volume Profile | Buying/selling pressure | Low (independent data source) |
Volatility indicators | ATR, Bollinger Bands | Range expansion | Low (independent data source) |
Pro Tip: Select one indicator from each independent category, not multiple tools from the same row in the table above. Trend plus volume plus volatility gives you three genuinely different perspectives. RSI plus Stochastic plus MACD gives you one perspective repeated three times.
How indicator overload leads to analysis paralysis
Analysis paralysis in trading is the state where a trader has all the information needed to act but cannot execute because conflicting signals create irreconcilable doubt. Conflicting signals freeze execution even when setup criteria are met, because traders wait for perfect alignment among indicators that were never designed to align perfectly. The trade sets up. The entry window opens. The trader stares at the chart waiting for one more confirmation that never comes.
The behavioral loop that creates this state is predictable. A trader takes a loss. They conclude their setup lacked confirmation. They add another indicator. The next trade produces more conflicting signals. They add another indicator to break the tie. Traders add indicators after losses hoping to prevent future drawdowns, but the additional tools deepen confusion rather than resolve it. Each new tool introduces another potential conflict, raising the bar for “perfect alignment” to an impossible standard.
The psychology behind this mirrors a well-documented behavioral phenomenon. Research on the paradox of choice shows that increasing choices drastically reduces action rates, causing decision difficulty and avoidance. The same cognitive mechanism operates on a trading chart loaded with eight indicators. More data does not produce more confidence. It produces more reasons to hesitate.
The Society of Technical Analysts and the STA blog have both documented how cluttered charts obscure price action and cloud decision-making. When the chart itself becomes hard to read, traders shift focus from the price to the indicators, which is exactly backward. Price is the primary signal. Indicators are secondary tools meant to support a reading of price, not replace it.
Common symptoms of indicator overload include:
Waiting for three or more indicators to agree before entering a trade
Regularly missing entries because confirmation arrives after the move
Feeling more anxious after adding a new indicator than before
Spending more time adjusting indicator settings than reviewing price structure
Abandoning a trade idea mid-setup because one indicator flips direction
Pro Tip: Cap your chart at three indicators maximum. Research on visual decision performance confirms that reducing visual search load shortens task completion time and cuts errors. Fewer objects on screen means faster, cleaner decisions.
Strategies to resolve indicator confusion and make clearer decisions
The fix for trading indicator confusion is not finding better indicators. It is using fewer indicators with clearly defined, non-overlapping roles. Experienced traders select indicators that each fulfill a distinct role, capping their total count to avoid confluence illusions. The practical framework is straightforward: one trend tool, one momentum tool, one volume or volatility tool. Each answers a different question. None of them overlap.
Here is a stepwise approach to simplifying your chart setup:
Audit your current indicators. List every indicator on your chart and write down what market dimension each one measures. If two indicators measure the same dimension, remove the slower or less reliable one.
Prioritize price action. Candlestick patterns, support and resistance levels, and trend structure are your primary signals. Indicators confirm. They do not lead.
Assign one role per indicator. Trend direction, entry timing, and trade context (volume or volatility) are the three roles. Fill each role with one tool only.
Set a decision deadline. Give yourself a fixed time window to act once your setup criteria are met. If the trade does not trigger within that window, skip it and move to the next opportunity.
Backtest with your simplified setup. Run your three-indicator framework against historical data before trading it live. Evidence from backtesting builds the confidence that prevents second-guessing in real time.
Interface design that reduces visual scanning also plays a measurable role in decision speed. A clean chart with three indicators and clear price levels processes faster than a chart with eight overlapping tools. This is not a preference. It is a measurable cognitive reality backed by research in financial interface design.
A practical example: a trader using a 50-period EMA for trend direction, RSI for momentum confirmation, and On-Balance Volume for buying pressure has three independent data sources. When all three align, the signal is genuinely confirmed. When they conflict, the conflict is meaningful because the tools measure different things. That is the only kind of conflict worth analyzing.
Common misconceptions about indicator confirmation
The most damaging myth in technical analysis is that more indicators equal stronger confirmation. Adding multiple indicators answering the same question gives false confirmation and causes under-trading due to lack of perfect alignment. Traders who stack RSI, Stochastic, and MACD believe they are requiring three independent votes. They are actually requiring one vote, cast three times, to reach a unanimous count.
True independent confirmation requires tools from different categories measuring different market dimensions. A trend indicator agreeing with a volume indicator is genuine confirmation. RSI agreeing with Stochastic is not confirmation. It is correlation.
The distinction between real and apparent confirmation breaks down like this:
Apparent confirmation: RSI above 50 + Stochastic above 50 + MACD histogram positive. All three measure momentum. One factor, three readings.
Real confirmation: 50 EMA trending up + RSI above 50 + OBV rising. Three different market dimensions pointing the same direction.
Multi-timeframe trap: A 1-hour RSI and a 4-hour RSI both showing overbought conditions. This feels like confirmation across timeframes, but both tools still measure the same momentum dimension.
Traders often misinterpret agreement among similar indicators as strong confirmation when they are measuring the same underlying factor. The practical test for any indicator you add is this: does it answer a question that none of your existing indicators answer? If not, it adds noise, not signal. Repainting indicators compound this problem further. A tool that rewrites its past signals creates the illusion of historical accuracy while delivering unreliable real-time readings.
Key takeaways
Conflicting indicators confuse traders because most indicator combinations measure the same market dimension, creating redundancy rather than genuine confirmation.
Point | Details |
Root cause is redundancy | Most indicator conflicts come from stacking tools that measure the same data, not from genuine market disagreement. |
Analysis paralysis is behavioral | Traders add more indicators after losses, which deepens confusion instead of resolving it. |
Three indicators is the limit | One trend tool, one momentum tool, one volume or volatility tool covers all independent market dimensions. |
Real confirmation requires independence | RSI plus Stochastic is one signal counted twice. RSI plus OBV is two genuinely different signals. |
Clean charts decide faster | Reducing visual clutter shortens decision time and lowers execution errors, according to financial interface research. |
Why I stopped chasing perfect alignment years ago
I spent the better part of two years adding indicators every time a trade went wrong. After a bad short on EUR/USD, I added Williams %R to my RSI and MACD setup. After a missed breakout on Bitcoin, I layered in a second moving average. My chart eventually had seven tools running simultaneously, and I was less decisive than when I started with two. The irony is that the chart with seven indicators produced more losing trades, not fewer, because I was waiting for alignment that the math made nearly impossible.
The shift happened when I accepted a counterintuitive truth: a conflicting signal from a correlated indicator is not information. It is noise wearing the costume of information. Once I stripped my setup back to a trend filter, one momentum oscillator, and volume, the decisions became obvious. Not always right. But obvious. That clarity is what separates consistent execution from chronic hesitation.
The traders I have seen overcome analysis paralysis share one habit. They define their setup rules before the market opens, not during the trade. They decide in advance what combination of signals constitutes a valid entry, and they act on that combination without renegotiating mid-trade. Emotional awareness matters here too. If you feel the urge to add one more indicator before pulling the trigger, that urge is almost always anxiety, not analysis. Recognize it for what it is, and act on your pre-defined rules instead.
— James
Stop second-guessing your charts with Big Move Algo
If indicator overload is costing you entries and confidence, Big Move Algo cuts through the noise with a single, clear signal on your TradingView chart.
Big Move Algo delivers Long, Short, and Exit signals in real time across crypto, forex, stocks, indices, and commodities. The built-in Fake Trend Detector filters out low-quality market conditions automatically, so you are not trading in noise. AUTO Mode requires zero configuration to get started. There is no stack of conflicting oscillators to reconcile. Just a clean signal on a clean chart. Visit Big Move Algo to see the plans available, or check the how to use guide to understand exactly how the signals work before you subscribe.
FAQ
What causes indicators to give conflicting signals?
Indicators conflict because many tools measure the same market dimension at different speeds. RSI and Stochastic, for example, are both momentum oscillators derived from recent price ranges, so their disagreement reflects timing lag rather than a genuine difference in market conditions.
How many indicators should a trader use?
Three indicators is the practical maximum for most traders. One trend tool, one momentum tool, and one volume or volatility tool cover independent market dimensions without creating redundant or conflicting readings.
What is analysis paralysis in trading?
Analysis paralysis is the inability to execute a trade despite meeting setup criteria, caused by conflicting signals that create irreconcilable doubt. It typically worsens when traders add more indicators after losses, raising the bar for confirmation to an impossible standard.
Is RSI and Stochastic together a good confirmation strategy?
No. RSI and Stochastic both measure momentum using similar price range calculations, so their agreement counts one factor twice rather than providing independent confirmation. Pair a momentum oscillator with a volume indicator instead for genuine cross-category confirmation.
How do I know if my indicators are redundant?
Ask whether each indicator answers a question that none of your other indicators answer. If two tools both measure momentum, trend direction, or the same price dimension, one of them is redundant and should be removed from your setup.
Recommended
Comments