
Real-Time Indices Trading Signals: A Practical Guide
- Steven Hartwell

- Aug 11
- 10 min read

For retail traders, the fastest path to reliable indices trading signals is a real-time, adaptive indicator that fires Long, Short, and Exit alerts directly inside TradingView and pushes notifications to your phone. Skip the newsletter-style tip sheets. The S&P 500, NASDAQ/US100, and Dow don’t wait for a morning email.
Your immediate next step: Add a TradingView-native indicator to a paper trading account and run it for at least 30 trades before touching real capital. Big Move Algo is one such option, built specifically for this workflow.
Prefer indicators with AUTO mode for fast setup and a noise filter (like a Fake Trend Detector) to cut false signals.
Confirm the provider covers your target indices: S&P 500, NASDAQ/US100, Dow Jones, DAX, FTSE 100, and Nikkei 225.
Verify delivery: TradingView alerts, mobile push, and webhook support for automation.
Pro Tip: Before subscribing to any signal service, test it on TradingView’s built-in paper trading mode for a full month. Real edge shows up in a sample of trades, not a single screenshot.
Key Takeaways
Reliable indices trading signals combine real-time delivery, a noise filter, transparent backtests, and a risk-managed execution framework to give retail traders a consistent, repeatable edge.
Point | Details |
Signal fields matter | Every signal must include asset, direction, entry, stop-loss, take-profit, and a validity window. |
Paper-trade first | Run 30–90 trades in paper mode before risking real capital; log slippage on every fill. |
Simplicity outperforms | Adaptive signals with noise filters outlast complex, rigid indicator stacks over time. |
Risk 0.5–2% per trade | Size positions using percent-risk per trade; adjust for futures vs. CFD contract multipliers. |
Big Move Algo | A TradingView-native indicator with AUTO mode, Fake Trend Detector, and instant access after purchase. |
Table of Contents
What does a high-quality indices signal service actually include?
A credible trading signal is not just a directional arrow. According to Daytrading, every signal should specify the asset, timeframe, entry price, stop-loss, and exit target. Anything missing from that list is incomplete.
Signal fields to require:
Asset and contract type (cash index, futures, or CFD equivalent)
Timeframe (5-minute, 1-hour, daily)
Direction: Long, Short, or Exit
Precise entry price or zone
Stop-loss level
Take-profit target(s)
Validity window (when the signal expires)
Confidence score or filter status
Index coverage to expect: S&P 500 (SPX/ES), NASDAQ/US100 (NQ), Dow Jones (YM), DAX (GER40), FTSE 100 (UK100), and Nikkei 225 (JP225), plus their futures and CFD equivalents for actual execution.
Delivery and latency matter. TradingView alerts are the standard for indicator-based signals. Webhooks enable automated order routing. Mobile push, Telegram, email, and SMS cover manual execution. The gap between a signal firing and your order hitting the market is where edge gets lost.
Operational features worth checking:
AUTO mode for minimal setup vs. MANUAL mode for customization
A noise filter or Fake Trend Detector to suppress low-quality setups
Historical sample trades (not just a cumulative return chart)
A clear trial or demo option before you commit
Pro Tip: Analyst commentary can add context, but your execution decision should follow the objective signal fields, not the narrative. Treat commentary as confirmation, not the trigger.
How are indices trading signals actually generated?
The pipeline behind any signal service follows roughly the same sequence: raw price and volume data feeds in, indicators compute, patterns get detected, a score or filter qualifies the signal, and then it gets distributed.
ActivTrades documents the most common inputs: moving average crossovers, RSI momentum, MACD divergence, Bollinger Band breakouts, Fibonacci retracements, and volume spikes. Most providers layer two or three of these together rather than relying on a single indicator.
Three signal generation models, and their tradeoffs:
Manual analyst signals: A human reviews charts and publishes a call. Adds context, but introduces latency and subjectivity. Harder to backtest systematically.
Deterministic algorithmic signals: Fixed rules fire automatically when conditions are met. Fast and consistent, but rigid. A rule that worked in 2022 may not hold in a trending 2026 market without revalidation.
AI/ML-validated signals: A model scores setups based on historical patterns and adapts weights over time. Higher ceiling, but also higher risk of overfitting if not validated on out-of-sample data.
Backtesting shows how a signal strategy performed on historical data. Walk-forward testing is the more honest version: you train on one period, test on the next, and repeat. Out-of-sample results are what actually matter. Any provider who only shows in-sample backtests is showing you the best possible version of their system, not a realistic one.
The 4-step signal flow:
Data ingestion (price, volume, volatility)
Indicator computation and pattern detection
Signal scoring and noise filtering
Distribution via TradingView alert, webhook, or push notification
Pro Tip: Ask any provider for their walk-forward test results, not just the equity curve. A smooth equity curve built entirely on in-sample data is a warning sign, not a selling point.
How to execute a signal into a complete trade plan
Receiving a signal is step one. Turning it into a trade without blowing your risk budget is the part most guides skip.
Validate before you execute. Check confluence: does the higher timeframe trend agree? Is there a volume spike confirming the move? Is there a major economic release in the next hour that could invalidate the setup?
Confirm the contract. Cash index, futures, or CFD? Each has different margin, spread, and overnight funding costs. Know which one you’re trading before the signal fires.
Align the timeframe. A 15-minute signal on the S&P 500 futures (ES) should not be managed with a daily stop-loss. Match your stop distance to the signal’s timeframe.
Place entry, stop-loss, and take-profit simultaneously. Don’t enter and then decide on the stop later. The stop goes in with the entry, every time.
Size the position using percent-risk. A standard range is 0.5–2% of account equity per trade.
Position sizing example for a $10,000 account:
For CFDs, the math is similar but the multiplier differs by broker. Always confirm the contract value before sizing.
Automating execution via TradingView webhooks and broker APIs removes the hesitation delay. You configure the alert message, the webhook endpoint receives it, and the broker fires the order. Test this in paper mode first.
Pro Tip: Log every trade with the signal’s entry, stop, target, and your actual fill. Slippage compounds over dozens of trades. You won’t see it until you measure it.
How to read performance claims and spot misleading backtests
Providers love to show equity curves. What they often hide is more important than what they show.
Metrics to require before subscribing:
Metric | What It Tells You | Minimum Acceptable |
Net return | Profit after fees and slippage | Positive, out-of-sample |
Max drawdown | Worst peak-to-trough loss | Disclosed, not omitted |
Win rate | % of trades closed profitable | Context-dependent |
Average R-multiple | Avg profit relative to risk | Above 1.0 preferred |
Sharpe ratio | Return per unit of risk | Above 1.0 is reasonable |
Number of trades | Statistical sample size | 100+ for reliability |
AvaTrade’s educational guide is direct on this: providers should publish transparent backtests, sample trade logs, and disclose slippage and fees so traders can assess real-world performance. If a provider won’t show you individual trade logs, that’s a red flag.
Red flags to watch for:
Cherry-picked timeframes (showing only the best 6-month window)
Fees excluded from return calculations
Fewer than 50 trades in the sample
No walk-forward or out-of-sample test
Undisclosed slippage or execution latency
Sample trade log format to request:
Past performance does not guarantee future results. But a provider who publishes audited, out-of-sample trade logs with disclosed fees is giving you something real to evaluate. One who only shows a cumulative return graph is not.
How signals are delivered and connected to execution
TradingView alerts are the practical standard for indicator-based signals. When an indicator fires, TradingView can push a notification to your phone, send an email, or fire a webhook to an automated execution system. That last option is what separates a manual workflow from a semi-automated one.
Delivery channel comparison:
TradingView alerts + webhook: Lowest latency for automation. Alert fires, webhook hits broker API, order executes. Ideal for systematic traders.
Mobile push notifications: Fast for manual execution. You still have to place the order yourself, which adds 5–30 seconds of latency.
Email and SMS: Reliable for awareness, not for execution. By the time you read an email, the entry price may have moved.
Telegram bots: Popular for community-based signal services. Latency depends on the bot’s server and your connection.
For TradingView indicator categories and alert setup, the integration steps are straightforward: enable the alert on the indicator, set the condition, write the webhook message in JSON format, and point it at your broker’s API endpoint. Test every step in paper mode before going live.
Reliability checklist for any delivery system:
Uptime SLA or historical uptime record
Alert queuing (does it hold alerts if your connection drops?)
Duplicate suppression (does it fire the same signal twice?)
Confirmation receipts (do you know the alert was received?)
What does indices signal pricing typically look like?
Most retail signal services follow a monthly or annual subscription model. Annual plans usually run at a discount compared with monthly. Per-signal fees and performance-sharing arrangements exist but are rare for retail-facing products.
Typical pricing tiers:
What separates a trustworthy provider from a questionable one at any price point: transparent pricing with no hidden fees, a trial period or money-back guarantee, and a clear feature matrix that tells you exactly what you get before you pay.
Big Move Algo offers subscription access processed through Stripe, with instant access after purchase. You can test the indicator in TradingView’s paper trading environment before committing real capital.
Before you subscribe to any service:
Confirm the trial or demo terms in writing
Check whether the price includes all indices or just a subset
Verify AUTO mode is included, not an add-on
Test latency from alert to your execution platform
Quick start checklist: testing signals safely before going live
The goal here is simple: prove the signal works in your hands before you risk real money.
Paper-trade for 30–90 trades using identical position sizing and execution rules you plan to use live. Don’t adjust the rules mid-test.
Log every fill. Record the signal’s entry price, your actual fill, the stop-loss, and the exit. Calculate slippage on each trade.
Validate signal latency. Time the gap from alert to order placement. For real-time signal delivery, even a 10-second delay can shift your entry meaningfully on a fast-moving index.
Review after 30 trades. Calculate win rate, average R, and max drawdown. If the numbers are consistent with the provider’s published backtest, you have a reasonable basis to continue.
Adjust stop and size rules based on your actual slippage data, not the theoretical model.
Scale to live only after two consecutive positive review periods. One good month proves nothing. Two consistent ones are a signal worth trusting.
Copy this checklist into your trading journal and check off each step before adding real capital.
Why simpler signals tend to outlast complex ones
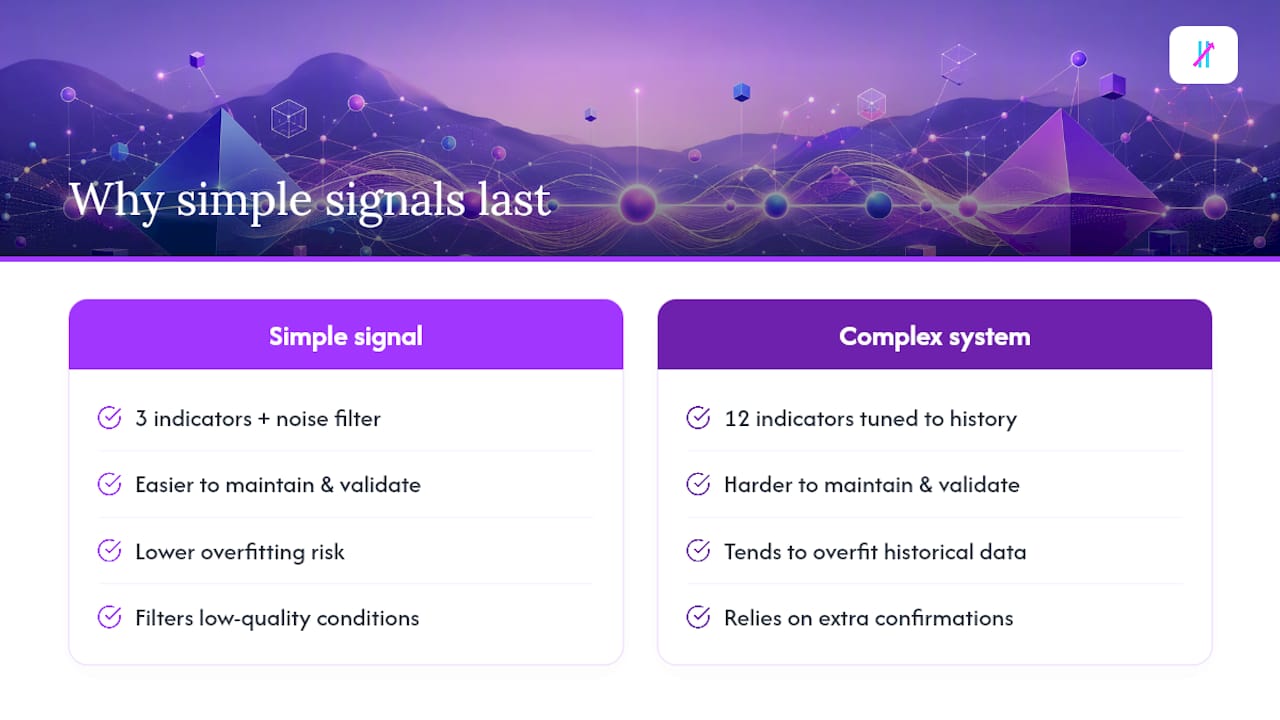
Investopedia’s analysis of trade signals makes the case plainly: simple, adaptable signals are easier to maintain and validate than complex, rigid indicator stacks. Complex systems tend to overfit historical data and break down when market conditions shift.
Major indices have the liquidity to support reliable execution of real-time signals. The World Federation of Exchanges publishes exchange statistics showing the depth and daily turnover concentrated in major indices and futures markets. That liquidity is what makes tight-spread execution possible when a signal fires.
The practical implication: a signal built on three well-chosen indicators with a noise filter will usually outlast a system built on twelve indicators tuned to a specific historical period. The Fake Trend Detector concept in Big Move Algo reflects this directly. It filters out low-quality market conditions rather than trying to trade through them. That’s a design choice grounded in the same principle.
The traders who last aren’t the ones with the most indicators. They’re the ones who know when NOT to trade. A well-designed noise filter does more for long-term performance than adding a fifth confirmation signal ever will.
Revalidate your signal parameters every quarter. Markets rotate. A setup that worked in a low-volatility trending environment may need adjustment in a choppy, range-bound one. Walk-forward testing, run on a rolling basis, catches this drift before it costs you.
Pro Tip: Set a calendar reminder every 90 days to review your signal’s performance metrics against its published backtest. Drift between live results and historical expectations is an early warning sign.
An editorial perspective on signals and trader behavior
The debate between manual discretion and AUTO mode misses the real issue for most intermediate traders. The problem isn’t which mode you use. It’s consistency.
Signal-hopping is the behavioral trap that kills more accounts than bad signals do. A trader subscribes, gets two losing trades, switches to a different provider, gets two more losses, and concludes that signals don’t work. What actually happened is they never gave any single approach enough trades to show its statistical edge. Thirty trades is the minimum sample. Ninety is better.
The blended approach that works: use AUTO mode to generate the signal, then apply a single manual confluence check (higher timeframe trend, for example) before executing. That one filter adds judgment without opening the door to second-guessing every setup. The benefits of automated signals are real, but only if you let the system run long enough to prove itself.
Volatile index sessions, like a Fed announcement day on the S&P 500, are where clear Long/Short/Exit signals earn their keep. When price is moving fast and your instinct is to freeze or overtrade, a structured signal gives you a decision framework. That’s not a small thing.
Big Move Algo: a TradingView-native signal indicator worth testing
Real-time indices signals without the complexity of a multi-platform setup are what Big Move Algo delivers. The indicator runs natively inside TradingView and fires Long, Short, and Exit signals across indices, crypto, forex, stocks, and commodities.

AUTO mode gets you live in minutes with no manual configuration. MANUAL mode lets experienced traders adjust parameters to their strategy. The built-in Fake Trend Detector filters out low-quality market conditions automatically, so you’re not forced to sit out bad setups manually. Alerts reach you via TradingView’s native system, mobile push, and webhook for automated execution. Payment processes through Stripe, and access is instant after purchase. The indicator runs on unlimited devices.
Try Big Move Algo on TradingView in paper mode first. Run 30 trades, log your fills, and check the results against the published signal logic before committing real capital.
Sources
The sources below back the claims in this article and are worth reading directly before you commit capital to any signal service.
This article is general information, not a substitute for advice from a qualified financial advisor. Consult a qualified financial professional about your own circumstances before acting on anything here.
Recommended
Comments