
TradingView Buy/Sell Signals for Active Traders: 2026 Guide
- Steven Hartwell

- 11 minutes ago
- 14 min read

TradingView buy/sell signals are timing tools, not oracles. The right way to use them: treat every signal as a confluence trigger inside a structured workflow, confirm it after candle close, and pair it with a hard stop before you size a position. That framing alone separates traders who profit from signals from those who blow up chasing them.
Three things you can do right now, in under five minutes:
Open TradingView, click Indicators, search “buy sell,” and add one public script that explicitly states “non-repainting” in its description.
Set the alert to trigger only on bar close (not on every tick) so the signal confirms after the candle closes.
Enable a TradingView alert with a sound or push notification so you never miss a confirmed entry.
Big Move Algo’s Big Move Guard is one of the more practical commercial options on TradingView for this workflow: it ships with a Fake Trend Detector, AUTO and MANUAL modes, and pre-built alerts. More on that later. First, here is everything you need to find, configure, test, and execute with TradingView buy/sell signals.
Key Takeaways
The most reliable TradingView buy/sell signals come from multi-condition confluence systems with non-repainting confirmation, ATR-based stops, and a disciplined execution workflow, not from any single indicator used in isolation.
Point | Details |
Confirm after bar close | Set all alerts to “Once Per Bar Close” to prevent repainting signals from triggering false entries. |
Use confluence, not single indicators | Require at least 3 aligned conditions (trend, momentum, volume) before acting on any buy/sell signal. |
Tune tempo per asset | Adjust EMA or RSI period until signal cadence matches your monitoring frequency; jittery signals need longer periods. |
Add a cooldown filter | Set a minimum bars-between-signals parameter to prevent signal clustering in choppy, sideways markets. |
Size by ATR, not intuition | Calculate position size as (account × risk%) ÷ (ATR × multiplier) to keep risk consistent across volatility regimes. |
Big Move Algo | Big Move Guard integrates Fake Trend Detector, AUTO/MANUAL modes, and non-repainting alerts in one TradingView indicator. |
Table of Contents
How do you choose and configure the right buy/sell indicator?
How should you test and validate buy/sell signals on TradingView?
How do you set up alerts and automation from indicator signals?
What risk management rules should you pair with buy/sell signals?
Big Move Algo brings these filters together in one TradingView indicator
Where to find TradingView buy/sell signal indicators
The TradingView Scripts & Indicators library is the single place to start. From any chart, click the Indicators button at the top of the screen, then select the Community Scripts tab. Type “buy sell” in the search bar and you will see hundreds of results ranked by likes, views, and recency.
Built-in vs. community vs. publisher scripts
TradingView ships with a set of built-in indicators (MACD, RSI, Bollinger Bands, EMA, and so on) under the Technicals tab. These are reliable, well-documented, and non-repainting by definition. They do not generate explicit buy/sell labels on the chart, but they form the building blocks for every signal system you will encounter.
Community scripts are public Pine Script programs written by TradingView users. They range from simple EMA crossovers to complex multi-confluence scoring systems. The quality varies enormously. Before adding any community script, check three things on its script page: whether the Pine Script source is visible (open-source scripts are auditable), the last updated date and Pine Script version (Pine v6 scripts tend to use more robust language constructs), and the user comments section for real-world feedback on repainting behavior or bugs.
Publisher scripts are sold or distributed by verified TradingView vendors. They often hide the source code, which means you cannot audit the logic directly. That is not automatically a red flag, but it does mean you rely on the publisher’s documentation and reputation.
Pro Tip: Sort community scripts by “Most Liked” and filter by “Open Source” to surface scripts that have been peer-reviewed by the community and whose logic you can inspect line by line.
What types of buy/sell indicators are on TradingView?
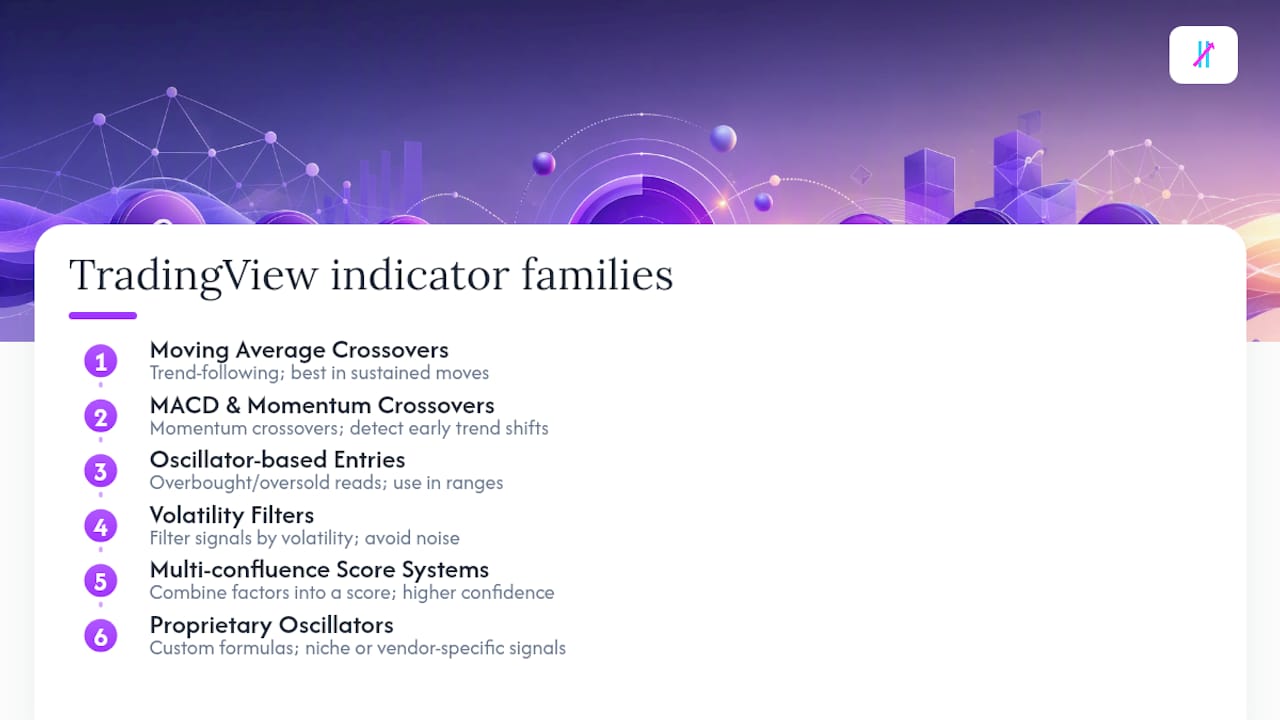
Understanding the signal logic behind an indicator tells you when it will work and when it will fail. There are six main families.
Moving average crossovers (EMA/SMA)
A fast EMA crossing above a slow EMA generates a buy label; the reverse generates a sell. Simple, transparent, and widely used. The EMA crossover with ATR-based dynamic stops by kelfry98 extends this by adding automatic TP1/TP2/TP3 levels and a live dashboard, so the signal and the trade plan appear on the same chart. Crossovers work well in trending markets and poorly in choppy, sideways conditions where they produce frequent whipsaws.
MACD and momentum crossovers
MACD fires when the MACD line crosses the signal line, often combined with a histogram zero-cross for confirmation. Momentum crossovers tend to lag by a few bars, which is actually useful for swing traders who want confirmation over speed. Pair MACD with RSI to avoid buying into overbought conditions.
Oscillator-based entries (RSI, Stochastic)
RSI below 30 or Stochastic in oversold territory can trigger buy signals; the reverse for sells. These work best in ranging markets and fail in strong trends where RSI can stay “overbought” for weeks. The dual-RSI approach by KenshinC adds a 3-bar price momentum confirmation and both long and short MA filters, which makes it more reliable on the 1H to Daily timeframes than a raw RSI threshold alone.
Volatility filters (Bollinger Bands, ATR)
Bollinger Band reversals fire when price touches or pierces the outer band and then closes back inside. ATR-based gates prevent signals from firing during low-volatility compression, which is when false breakouts are most common. The Smart Buy/Sell Signal Indicator by TradeTechanalysis combines Supertrend, Bollinger Bands, RSI, ADX, and a moving average with a trade cooldown to reduce false breakouts and includes webhook-ready alerts.
Multi-confluence score systems
These are the most sophisticated category. The indicator tallies “votes” from multiple sub-indicators and only fires when a minimum score is reached. The Smart Buy Sell MultiConfluence by GerardMali scores seven indicators (EMA alignment, RSI, MACD, Stochastic, ADX, Bollinger Bands, Volume) and requires a minimum of 4/7 or 6/7 to trigger, displaying the score on the chart as “BUY 6/7.” Fewer signals, but each one carries more weight.
Proprietary oscillators (MRC, JMA)
Some scripts introduce custom oscillators to reduce lag. The BRT Signals Buy/Sell v2 uses a proprietary Mean Reversion Channel (MRC) oscillator and Jurik Moving Average (JMA) support alongside ADX modifications to improve trend detection. These are harder to audit but can outperform standard oscillators in specific market conditions.
Non-repainting vs. repainting signals
This distinction matters more than any other technical detail. A repainting indicator recalculates past bars as new data arrives, making historical signals look perfect in a backtest that would have been impossible to trade in real time. A non-repainting indicator locks its signal value once the bar closes and never changes it. Always confirm that a script explicitly states non-repainting behavior, and verify it yourself by watching whether past arrows shift position as new bars form. If they move, the script repaints.
How do you choose and configure the right buy/sell indicator?
Start with your trading style. Scalpers on the 1-minute to 5-minute chart need fast, low-lag signals and will tolerate more false positives. Swing traders on the 4-hour to Daily chart need fewer, higher-conviction signals and can afford to wait for confirmation. Position traders on the Weekly chart want trend-following systems with wide stops and minimal noise.
Matching indicator family to goal
Scalping (1m–5m): Fast EMA crossovers, ATR gates to filter low-volatility periods, volume confirmation.
Intraday (15m–1H): SMA + RSI + volume systems like the Advanced v2 by reeagsy, which uses a 14-period SMA trend filter plus RSI and volume thresholds.
Swing (4H–Daily): Multi-confluence score systems, dual-RSI with MA filters, Supertrend + Bollinger reversals.
Position (Weekly): Trend-following MA systems with wide ATR stops and ADX strength gating.
Tuning tempo
The most overlooked configuration step is finding the right cycle period for your specific asset. Think of it like adjusting a rifle scope: too short a period and every small price move triggers a signal (jittery); too long and the signal arrives well after the move is over (lagging). Lengthen the EMA period or RSI lookback if signals fire too frequently. Shorten them if signals consistently arrive late. The goal is a cadence that matches how often you can monitor or automate your trades.
This concept of tuning indicator tempo per asset is documented in several advanced TradingView scripts and is one of the most practical configuration habits you can build.
Filters that reduce false signals
Four filters consistently improve signal quality across indicator families:
ADX strength gate: Only take signals when ADX is above 20–25, confirming that a trend exists.
Volume confirmation: Require above-average volume on the signal bar to filter low-conviction moves.
ATR gate: Skip signals when ATR is below a threshold, avoiding entries during compression.
Cooldown (minimum bars between signals): Prevent signal clustering in choppy markets by requiring a minimum number of bars between consecutive signals. This is an under-appreciated mechanism that the Smart Buy/Sell Signal Indicator implements explicitly.
Pro Tip: Avoid over-optimizing parameters to fit historical data. Choose settings that perform reasonably across at least three different market regimes (trending up, trending down, sideways) rather than settings that look perfect on one six-month backtest. Robust settings generalize; curve-fitted settings fail.
How should you test and validate buy/sell signals on TradingView?
A signal system that looks good on a chart is not the same as one that holds up in live trading. Testing is the step most retail traders skip, and it is the step that separates a working system from an expensive lesson.
Testing checklist
Backtest with Strategy Tester. Convert your indicator logic to a strategy script (or use a script that includes a built-in strategy) and run it through TradingView’s Strategy Tester. Check results across at least 200 trades and multiple market conditions.
Check for overfitting. If the strategy’s equity curve is perfectly smooth in the backtest period, that is a warning sign. Over-optimization is a common failure mode: parameters tuned to fit one period often collapse when market conditions shift.
Run a walk-forward test. Optimize on the first 60% of your data, then test on the remaining 40% without touching the parameters. If performance degrades sharply on the out-of-sample period, the system is curve-fitted.
Paper trade forward. Run the system in TradingView’s paper trading mode for at least 30 live signals before committing real capital. Log every trade: entry reason, signal score, stop level, and outcome.
Review across regimes. Deliberately test in a trending period, a ranging period, and a high-volatility event. A system that only works in one regime is not a system; it is a coincidence.
Metrics to track
Win rate: Useful only in context of average R:R. A 40% win rate with 2.5:1 R:R is profitable; a 60% win rate with 0.8:1 R:R is not.
Average R:R: Target at least 1.5:1 before considering live trading.
Max drawdown: The largest peak-to-trough equity drop. Keep it below a level you can psychologically and financially sustain.
Expectancy (edge): Win rate × average win minus loss rate × average loss. Positive expectancy is the minimum bar.
Signal frequency and clustering: Too many signals in a short window often indicates a choppy market condition where the system should not be trading. A cooldown parameter directly addresses this.
Modern Pine Script v6 features, including enhanced alert payloads and improved Strategy Tester compatibility, make it easier to build non-repainting indicators and run honest backtests than in earlier versions of the language.
A backtest that looks too good almost always is. The most dangerous number in trading is a 90% win rate on a two-year backtest with 50 trades — that is not an edge, it is a sample size problem dressed up as a strategy.
Practical buy/sell templates you can add to TradingView
These are textual motifs, not full code. Each describes the logic you would implement in Pine Script or find in the public library.
EMA crossover with ATR dynamic SL/TP
Fast EMA (9) crosses above slow EMA (21) on a confirmed bar close. ATR (14) × 1.5 sets the stop below the signal bar’s low. TP1 at 1× ATR, TP2 at 2× ATR, TP3 at 3× ATR. The kelfry98 Buy Sell Signal implements this pattern with a live dashboard and position tracker.
MACD crossover + RSI + volume filter
MACD line crosses signal line from below (buy) or above (sell). RSI must be below 60 for buys and above 40 for sells to avoid extreme overbought/oversold entries. Volume on the signal bar must exceed the 20-bar average. This three-condition gate cuts signal frequency roughly in half compared to a raw MACD crossover, with a meaningful improvement in signal quality on intraday charts.
Multi-confluence score system
Seven sub-indicators each cast a vote: EMA alignment, RSI direction, MACD histogram, Stochastic crossover, ADX strength, Bollinger position, and volume. A buy fires only when the score reaches 5/7 or higher. The score displays on the chart so you can see how close a near-miss was. This is the approach behind the Smart Buy Sell MultiConfluence and it produces the fewest signals of any method here, but each one carries the most confluence weight.
Supertrend + Bollinger Band reversal
Supertrend sets the trend direction (bullish or bearish). A buy signal fires only when Supertrend is bullish AND price touches the lower Bollinger Band and closes back inside. This combination filters out counter-trend entries in strong moves and is particularly effective on the 1H to 4H timeframe for crypto and forex.
Dual-RSI 3-bar confirmation with MA filters
Two RSIs (one calculated from lows, one from highs) must both cross into oversold territory. Price must then close higher for three consecutive bars. A long MA filter (200 EMA) must confirm the broader trend direction. The KenshinC indicator uses this exact structure and is recommended for 1H to Daily charts where the 3-bar confirmation has time to develop cleanly.
Parameter ranges for common timeframes
These are illustrative ranges to test, not performance guarantees. Validate every combination on your specific asset before trading live.
Pro Tip: Start with a higher-timeframe chart to establish directional bias (e.g., Daily for swing trades), then drop to your entry timeframe (e.g., 4H or 1H) to time the actual entry. A buy signal on the 1H that aligns with a Daily uptrend carries far more weight than a 1H buy signal in a Daily downtrend.
How do you set up alerts and automation from indicator signals?
Alerts convert a visual signal into a real-time notification or an automated action. Getting this right is what separates a trader who catches every setup from one who misses half of them.
Creating TradingView alerts from indicator conditions
Right-click on any indicator output on the chart and select Add Alert on [Indicator Name], or use the alarm clock icon in the top toolbar. The most useful alert conditions for buy/sell systems are:
Confirmed buy/sell: Fires when the signal plots on a closed bar (set “Once Per Bar Close” in the alert settings).
TP hit: Price crosses a pre-defined take-profit level.
SL hit: Price crosses the stop level, signaling trade invalidation.
Opposite signal: A sell signal fires while you are in a long position, which is a common invalidation rule.
Always set alerts to “Once Per Bar Close” rather than “Once Per Bar” or “Every time.” The bar-close setting is what makes the alert non-repainting in practice.
Webhook basics and automation pipelines
TradingView supports webhook URLs as an alert delivery method. When a signal fires, TradingView sends a JSON payload to your webhook endpoint. A typical pipeline looks like this: TradingView fires the alert, the webhook endpoint receives the payload, a middleware service (or a bot you configure) parses the signal and sends an order to a broker or exchange API.
Automation amplifies both good systems and bad ones. A validated, profitable system becomes more consistent when automated. An untested system becomes a faster way to lose money. Never connect a webhook to a live account before running at least 30 paper trades through the same pipeline.
Alert best practices
Require confirmed-after-close alerts for every entry signal, without exception.
Set a cooldown in the indicator itself so the alert does not fire on every bar in a choppy cluster.
Test your webhook in a paper or sandbox environment before connecting to a live account.
Include trade metadata in the webhook payload: signal direction, entry price, stop level, and TP levels. This makes downstream automation cleaner and gives you a log to review.
Keep a kill-switch: a manual override that disables the bot or closes all positions immediately. Hardware failures, API outages, and unexpected market events happen.
Pine Script v6 supports richer alert message templates, which means modern scripts can embed dynamic values (current price, ATR value, signal score) directly into the webhook payload.
What risk management rules should you pair with buy/sell signals?
A signal tells you when to consider a trade. Risk management tells you how much to risk and where to exit. Without the second part, the first part is just noise.
Execution checklist
Confirm trend bias first. Check the higher-timeframe trend before acting on any signal. A buy signal in a downtrend requires a much higher confluence score to justify.
Set an ATR-based stop. Place your stop at entry price minus (ATR × multiplier) for longs, or plus for shorts. This adapts the stop to current volatility rather than using an arbitrary fixed distance.
Size by percentage risk. Risk no more than 1–2% of your account per trade. Calculate position size as: (account × risk%) ÷ (stop distance in price terms).
Set a clear TP or scaling plan. Know before entry whether you are targeting a fixed R:R, a key level, or scaling out at TP1/TP2/TP3.
Use a cooldown or invalidation rule. If an opposite signal fires before your TP is hit, close or reduce the position. Do not wait for the stop.
Position sizing example
Suppose your account is $10,000 and you risk 1% per trade ($100). Your asset is trading at $50,000 (Bitcoin, for example) and ATR (14) is $1,200. You set your stop at 1.5× ATR below entry: $1,800 stop distance. Position size = $100 ÷ $1,800 = 0.0556 BTC. That is a concrete, volatility-adjusted size that keeps your risk fixed regardless of how large the price move turns out to be.
For more on entry signal visualization and dynamic stop/TP calculations, the mechanics translate directly to any asset class.
Pro Tip: Before entering any trade, write one sentence: “I am buying [asset] at [price] because [signal reason], with a stop at [level] and a target at [level].” Reading it back takes five seconds and removes the emotional ambiguity that causes most execution mistakes.
What a practical trader’s workflow actually looks like
Signals fit into a workflow, not the other way around. The workflow comes first.
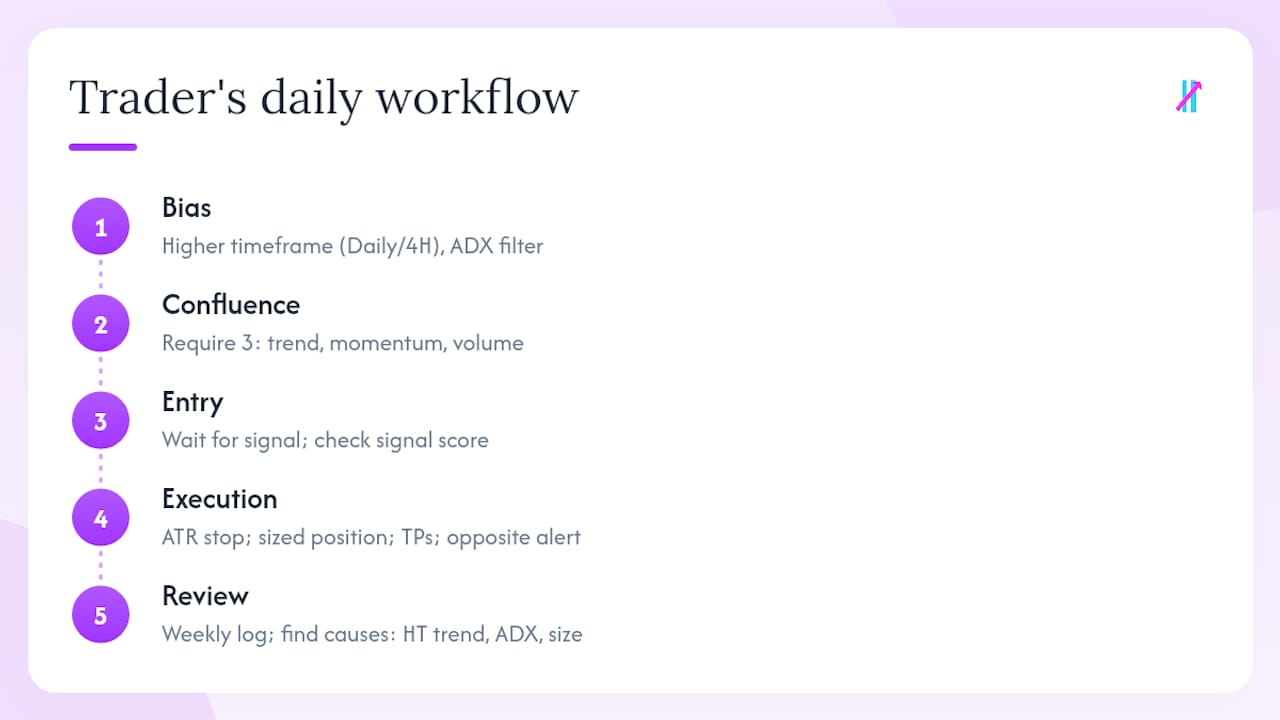
My daily process runs in five stages: bias, confluence, entry, execution, and review. In the morning, I check the higher-timeframe chart (Daily or 4H) to establish directional bias. I am not looking for a signal yet; I am deciding whether conditions favor longs, shorts, or no trade at all. If the Daily chart is in a clear uptrend with ADX above 25, I am only looking for buy signals on the 1H. If the Daily is choppy and ADX is below 20, I sit on my hands.
Once bias is set, I drop to the entry timeframe and wait for confluence. I want at least three conditions aligned: trend direction, momentum confirmation, and volume. When a signal fires and all three align, I check the signal score if the indicator shows one. A “BUY 6/7” on a multi-confluence system in a Daily uptrend is a very different proposition from a “BUY 3/7” in a sideways market.
Execution follows the checklist above: ATR stop, sized position, TP levels set, alert on the opposite signal. Then I leave it alone. The most common mistake I see traders make is adjusting stops and targets mid-trade based on new signals, which turns a rule-based system into an emotional one.
Weekly review is non-negotiable. I log every trade, check whether the signal was valid at the time (not in hindsight), and look for patterns in the losses. Most losing streaks trace back to one of three things: trading against the higher-timeframe trend, ignoring the ADX filter, or sizing too large.
Signals are not 100% accurate. No system is. The goal is a positive expectancy over a large sample, not a perfect record on any given week. Combining indicators thoughtfully is what builds that edge; chasing the “best” single indicator is what wastes it.
Big Move Algo brings these filters together in one TradingView indicator
Most traders who build the workflow above from scratch spend weeks assembling and testing individual scripts. Big Move Guard packages the core elements into a single TradingView indicator designed for retail traders who want a structured system without building one from scratch.

The features map directly to the checklist in this guide. The Fake Trend Detector filters out low-quality market conditions where signals are statistically unreliable, which is the equivalent of the ADX gate and cooldown discussed earlier. AUTO Mode handles confluence weighting automatically, so you get clear Long, Short, and Exit signals without manually combining five indicators. Manual Mode lets experienced traders adjust sensitivity and filters to match their specific asset and timeframe. Multi-TP support, ATR-based dynamic stops, and non-repainting signal confirmation are built in.
Getting started takes about ten minutes: subscribe, install Big Move Guard on TradingView, select AUTO Mode, enable bar-close alerts, and run it in paper trading mode for at least two weeks before going live. The subscription includes free updates and works across crypto, forex, stocks, indices, and commodities on unlimited devices.
Sources
The scripts and pages below are the primary references cited in this guide. Open-source scripts show the Pine Script source directly on the script page; publisher scripts may hide the code.
Indicators and strategies — TradingView
This article is general information, not a substitute for advice from a qualified financial advisor. Consult a qualified financial professional about your own circumstances before acting on anything here.
Recommended
Comments