
TradingView Strategy Tester: What Traders Need to Know
- Steven Hartwell

- Jun 20
- 7 min read

The TradingView Strategy Tester is the platform’s built-in backtesting engine that lets traders simulate trading strategies on historical price data and generate detailed performance reports. Unlike a standard indicator, a strategy script written in Pine Script uses the strategy() function, which enables automatic trade simulation and produces a full Strategy Tester report. Indicators using indicator() only display signals on the chart. Understanding what a TradingView strategy tester does, and how to use it correctly, is the difference between building a reliable edge and chasing results that will never hold up in live markets.
What is a TradingView strategy tester and how do you access it?
The Strategy Tester is a panel built directly into TradingView’s charting interface. You do not need a third-party tool or external software. Setup takes about 5 minutes, and the process follows four clear steps.
Open any chart on TradingView and click the Pine Editor tab at the bottom of the screen.
Write or paste a Pine Script strategy that begins with the strategy() function, then click Add to chart.
The Strategy Tester panel appears automatically at the bottom of the screen once a valid strategy script is applied.
Use the four tabs inside the panel to review results: Overview, Performance Summary, List of Trades, and Properties.
Each tab serves a specific purpose:
Overview shows the equity curve, net profit, and a visual summary of trade outcomes over time.
Performance Summary breaks down win rate, profit factor, max drawdown, Sharpe ratio, and dozens of other metrics.
List of Trades logs every individual entry and exit with timestamps, prices, and profit or loss per trade.
Properties controls the backtesting settings: initial capital, order size, commission, and slippage.
Free TradingView accounts limit history to 5,000 bars. That restriction matters for daily chart strategies, where 5,000 bars covers roughly 20 years. For intraday strategies on a 1-minute chart, 5,000 bars covers only a few days. Paid plans extend this limit significantly.
What key metrics does the Strategy Tester measure?
The Strategy Tester produces a set of performance metrics that tell you how a strategy behaved on historical data. Knowing which numbers matter most prevents you from drawing wrong conclusions.
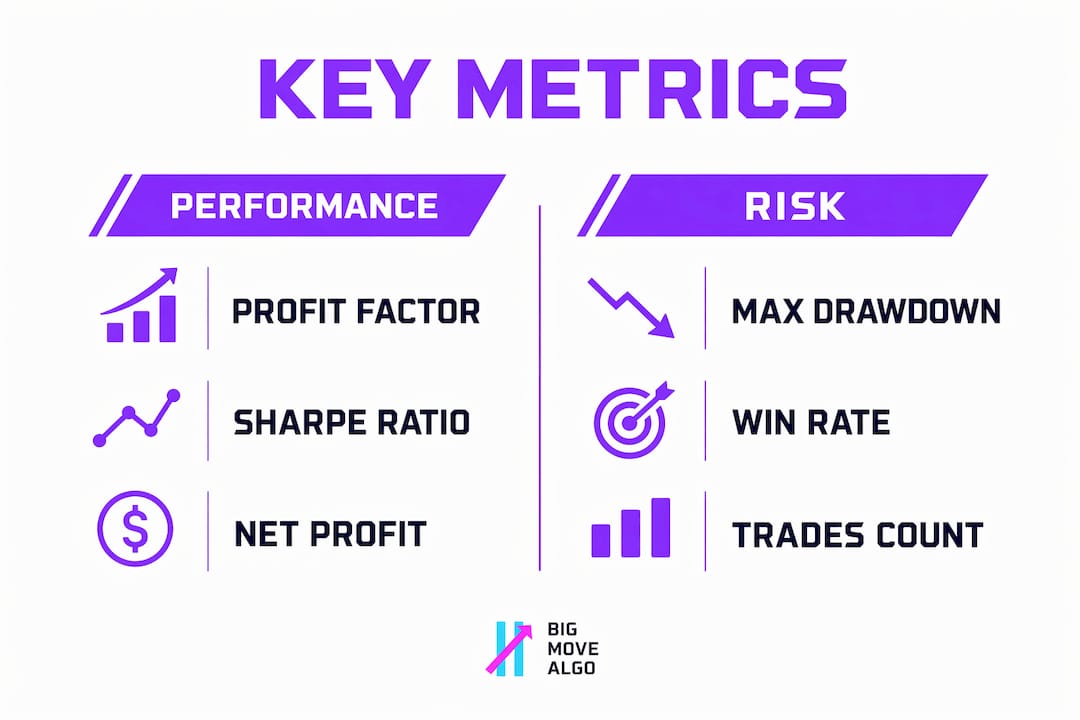
The most important metrics are:
Net profit: Total gain or loss over the test period, expressed in currency or percentage terms.
Win rate: The percentage of trades that closed profitably. A high win rate alone does not indicate a good strategy.
Profit factor: Gross profit divided by gross loss. A profit factor above 1.5 is generally considered acceptable for a live strategy.
Max drawdown: The largest peak-to-trough decline in the equity curve. This number defines the worst-case loss a trader would have experienced.
Sharpe ratio: A measure of risk-adjusted return. A Sharpe ratio above 1.0 indicates the strategy earns acceptable returns relative to its volatility.
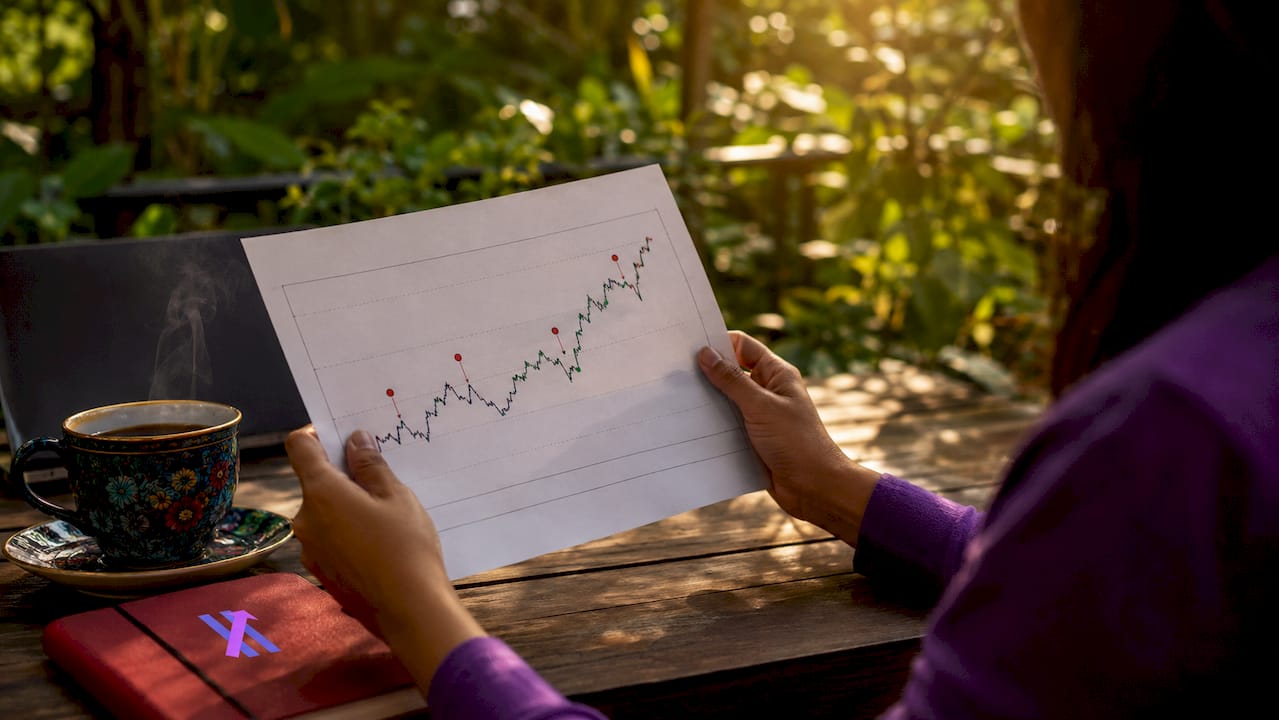
The equity curve deserves special attention. A smooth, upward-sloping curve suggests consistent performance across different market conditions. A jagged curve with long flat periods or sudden drops signals that the strategy depends on a small number of winning trades to stay profitable. That kind of strategy tends to fail in live trading.
Metric | What it tells you |
Profit factor | Whether gross wins outpace gross losses |
Sharpe ratio | Return quality relative to risk taken |
Max drawdown | Worst historical loss from peak to trough |
Win rate | Percentage of trades closed in profit |
Net profit | Total return over the test period |
Pro Tip: Never evaluate a strategy on profit alone. A strategy with a 90% win rate and a profit factor of 0.8 is a losing strategy. Always check profit factor and max drawdown together.
For traders who want to understand how TradingView overlay indicators differ from strategy scripts, the distinction matters most here. Indicators cannot generate these reports. Only strategies can.
Why do default backtesting settings produce misleading results?
Default TradingView backtest settings apply zero commission and zero slippage. Those defaults produce unrealistically high returns. Live trading results typically degrade to 60–70% of backtest values when realistic transaction costs are applied. That gap is large enough to turn a “profitable” backtest into a losing live strategy.
Most retail traders overlook realistic transaction costs and slippage, which drastically exaggerates backtest profitability. The fix is straightforward: set commission and slippage values in the Properties tab before drawing any conclusions.
Recommended settings by asset class:
Crypto spot: 0.1% per trade commission, 1–2 ticks slippage.
Forex: 0.5–1.0 pip spread equivalent, minimal slippage on major pairs.
Stocks: $0.005 per share or 0.05% per trade, plus 1–2 ticks slippage.
Futures: Use the actual exchange fee schedule and at least 1 tick slippage.
Data length matters just as much as cost settings. Statistically significant backtests require at least 100 trades. A sample of 200 or more trades provides better reliability, and 500 or more is the standard for high-confidence conclusions. Running a backtest over 50 trades and calling the strategy validated is a common and costly mistake.
Pro Tip: After setting your commission and slippage, run the backtest again and compare the new net profit to the default result. If the gap is larger than 30%, the strategy is too sensitive to transaction costs to trade live.
There is also a hidden risk with TradingView’s settings architecture. UI settings override Pine Script code if they are set in the Properties tab. A trader who hardcodes commission values in the script but leaves the UI at zero will get zero-cost results. Always confirm that both the code and the UI settings match.
Advanced techniques for reliable TradingView backtests
Getting a clean backtest result is only the first step. Validating that the result is real, and not a product of over-optimization, requires a more disciplined process.
Separate in-sample and out-of-sample data. Use the first 70% of your historical data to develop and tune the strategy. Reserve the last 30% as out-of-sample data. Test the final strategy on that reserved period without making further changes. A strategy that holds up on unseen data has a genuine edge.
Apply walk-forward optimization. Walk-forward optimization divides the full data set into multiple in-sample and out-of-sample windows, then tests the strategy repeatedly across each window. This method minimizes curve-fitting risk and confirms that the strategy works across different market regimes.
Enable Bar Magnifier for intraday strategies. Without Bar Magnifier, TradingView assumes all trades execute at the bar open or close. Bar Magnifier simulates intrabar price movements, which produces far more accurate stop-loss and take-profit execution for short-timeframe strategies.
Correct for look-ahead bias. Entry and exit logic that triggers on bar close can introduce look-ahead bias, inflating backtest results by 15–30%. Setting process_orders_on_close=false in Pine Script forces orders to execute on the next bar open, which reflects real execution conditions.
Synchronize code and UI settings. Confirm that commission and slippage values in the Pine Script match the Properties tab. Mismatches silently corrupt results.
“Walk-forward optimization is the closest thing to a real-world stress test for a backtested strategy. It does not guarantee future performance, but it does reveal whether a strategy has a consistent edge or was simply tuned to fit one specific period of history.” — TradingView Backtesting Guide
Traders who want to go further with signal quality can explore how to get clear long/short signals that feed directly into strategy testing workflows.
Key Takeaways
The TradingView Strategy Tester is a powerful backtesting tool, but accurate results depend entirely on realistic settings, sufficient trade samples, and disciplined validation methods.
Point | Details |
Strategies vs. indicators | Only Pine Script strategies using strategy() generate Strategy Tester reports. |
Realistic cost settings | Set commission and slippage in Properties before evaluating any backtest result. |
Trade sample size | Aim for at least 200 trades; 500 or more provides high-confidence conclusions. |
Look-ahead bias | Use process_orders_on_close=false to prevent inflated entry/exit results. |
Walk-forward validation | Test on reserved out-of-sample data to confirm a strategy has a genuine edge. |
What most traders get wrong about backtesting
The Strategy Tester is a tool for historical testing, not a prediction engine. That distinction sounds obvious, but most traders treat a strong backtest as proof that a strategy will work live. It is not.
The most common mistake I see is traders running a backtest on the default settings, seeing a 200% return, and immediately moving to live trading. They have not accounted for commission, slippage, or the fact that their 200% return came from 40 trades over three months. That is not a validated strategy. That is a sample size problem dressed up as a result.
The second mistake is misreading the equity curve. A smooth curve looks reassuring, but it can hide a strategy that only works in trending markets. When conditions shift to a range-bound environment, the equity curve flattens or drops. The backtest never showed that because the test period happened to be mostly trending. Always check whether the backtest period includes different market regimes: bull runs, bear markets, and sideways consolidation.
Paper trading before going live is non-negotiable. Run the strategy in TradingView’s paper trading mode for at least four to six weeks after a successful backtest. If the live paper results diverge significantly from the backtest, something in the setup is wrong. Fix it before risking real capital.
— Steven Hartwell
Take your trading further with Big Move Algo
Understanding the Strategy Tester gives you the foundation to test and validate ideas. The next step is having high-quality signals worth testing in the first place.

Big Move Algo is a proprietary TradingView indicator that delivers clear Long, Short, and Exit signals across crypto, forex, stocks, indices, and commodities. The built-in Fake Trend Detector filters out low-quality market conditions before they generate a signal. That means the signals you backtest are already pre-filtered for quality. Visit Big Move Algo to explore subscription plans and see how the indicator performs across live markets. You can also review the full usage guide to understand how to integrate it with your TradingView strategy testing workflow.
FAQ
What is the TradingView Strategy Tester?
The TradingView Strategy Tester is a built-in backtesting tool that simulates Pine Script trading strategies on historical price data and generates performance reports including equity curves, win rate, profit factor, and drawdown.
How is a strategy different from an indicator in TradingView?
A strategy uses the strategy() function in Pine Script and can simulate trades, while an indicator uses indicator() and only displays signals on the chart. Only strategies produce Strategy Tester reports.
How many trades do I need for a valid backtest?
A statistically meaningful backtest requires at least 100 trades, with 200 or more providing better reliability. Fewer than 100 trades produce conclusions that are too unreliable to act on.
Why do my backtest results look better than my live results?
Default TradingView settings apply zero commission and slippage. Live trading results typically reach only 60–70% of backtest values once realistic transaction costs are included. Always set commission and slippage in the Properties tab before evaluating results.
What is look-ahead bias in TradingView backtesting?
Look-ahead bias occurs when a strategy’s entry or exit logic uses data that would not have been available at the time of the trade. Setting process_orders_on_close=false in Pine Script corrects this and prevents inflated backtest results.
Recommended
Comments