
What Is a Long Signal in Trading? A 2026 Guide


A long signal in trading is defined as a data-driven market indicator that suggests conditions are favorable for buying or holding an asset, with the expectation that its price will rise. Price momentum, investor sentiment, and on-chain data are the three core components that form a valid long signal in 2026. The term maps directly to the industry concept of a bullish entry signal, which professional traders use across stocks, crypto, forex, and futures. Understanding what a long signal means, how to validate one, and when to act on it separates traders who profit consistently from those who react to noise.
What is a long signal in trading and how is it defined?
A long signal is the market’s way of telling you that buyers are in control and that price is likely to move higher. Long positions reflect confidence in future price appreciation and are the fundamental bullish stance across every major asset class. The signal itself is not a single data point. It is a confluence of indicators, including price action, volume, momentum, and sentiment, that collectively suggest a buying opportunity.
The phrase “long signal” is widely used in retail trading communities, but the precise industry term is a bullish entry signal or long entry signal. Both phrases describe the same concept. Using the standard terminology matters because it connects your analysis to a broader body of validated trading research.

Long-term traders treat long signals differently than active day traders. Long signals serve as contextual evidence to stay invested or build a position gradually, rather than as an immediate buy trigger. That distinction is critical. A signal does not mean “buy right now at any price.” It means the conditions favor a long position when your entry criteria are met.
What factors confirm a valid long entry signal?
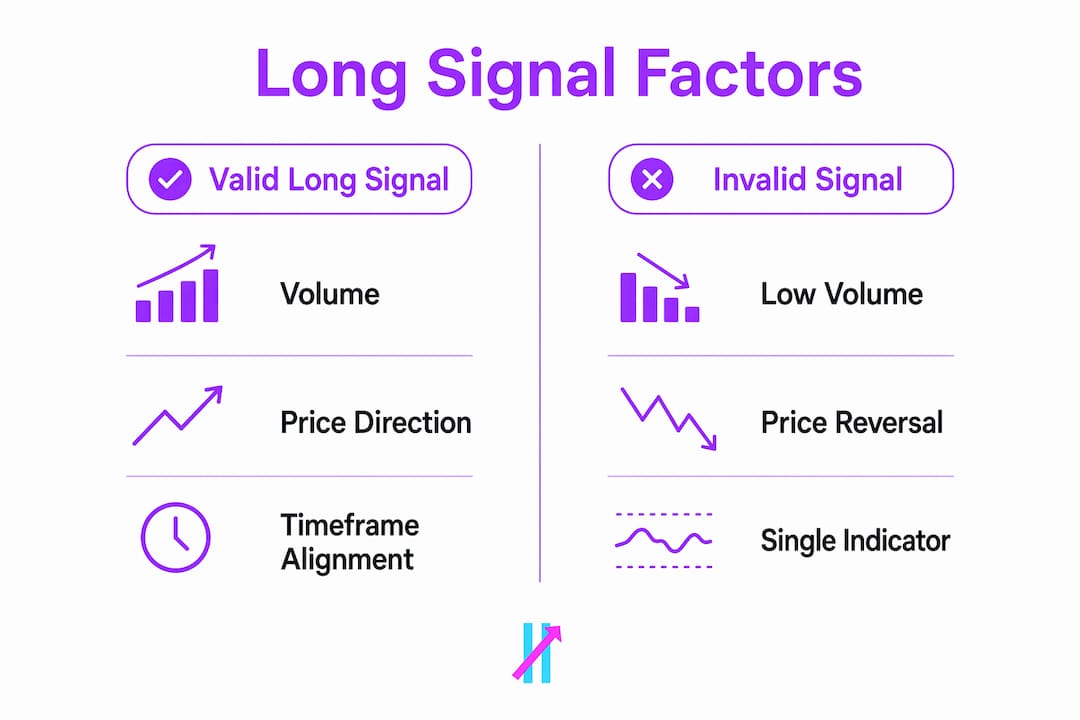
Valid long entry signals require more than a rising price. Volume is the first filter every serious trader applies.
Volume and price action confirmation:
Breakout candles on true long signals register 200–300% of average volume. That level of volume shows genuine buying pressure, not a thin-market fake-out.
Subsequent candles should maintain at least 120% of average volume to confirm follow-through.
A breakout on below-average volume is a warning sign, not a green light.
Multi-timeframe coherence:
Ignoring multi-timeframe coherence is the single most common cause of false signals among retail traders.
A bullish signal on a 15-minute chart that contradicts the 4-hour trend is likely noise from algorithmic activity.
True long signals align across both lower and higher timeframes, filtering out that noise.
Open interest and structure:
Rising open interest alongside rising price indicates fresh buyers entering the market, not just short sellers covering positions.
Structure improvement, meaning higher highs and higher lows on the chart, adds further confirmation.
Signals that appear near untested major resistance carry less weight, even when price and volume look favorable.
Pro Tip: Never base a long signal decision on a single short timeframe chart. Always check at least one higher timeframe to confirm the broader trend supports your entry.
What is Long Build Up and how does it strengthen trading long signals?
Long Build Up is a specific and particularly strong form of a bullish trading signal. Long Build Up occurs when price and open interest rise simultaneously, indicating that fresh bullish positions are actively being added to the market. This is different from a short-covering rally, where price rises simply because short sellers are buying back their positions to close trades.
The distinction matters because Long Build Up reflects genuine conviction. New buyers are committing capital at higher prices, which signals that the market expects further upside. Short-covering rallies, by contrast, tend to exhaust quickly once the covering is done.
Factor | Long Build Up signal | Basic long signal |
Price direction | Rising | Rising |
Open interest | Rising | Neutral or mixed |
Volume quality | Strong, above average | Variable |
Structure | Clear higher highs and lows | May be unclear |
Signal strength | High conviction | Moderate conviction |
Resistance proximity | Ideally clear of major levels | Not always assessed |
Quality of participation is what separates a strong Long Build Up from a weak one. Volume strength, structure improvement, and distance from heavy resistance all determine whether the signal will sustain a meaningful move.
Pro Tip: After spotting a Long Build Up, watch the next two to three candles for follow-through volume. Fading volume on the candles immediately after the signal is an early warning that the move may stall.
How do different timeframes affect long signal interpretation?
The timeframe you trade on determines how you interpret and act on a long signal. The same signal means different things to a day trader versus a swing trader versus a position trader.
Signal validity depends on expected price movement timeframes, and misaligning your trade style with the signal’s timeframe is a fast way to take unnecessary losses.
Day trades: Price is expected to move within 4–8 hours of the signal. If the asset has not moved in the anticipated direction within that window, treat the signal as false and exit or avoid the trade.
Swing trades: The expected move should materialize within 24–48 hours. Swing traders need to account for overnight risk and broader market sentiment shifts that can invalidate a signal by the next session.
Position trades: The move is expected to develop over 5–10 days. Position traders use higher timeframe confirmation as their primary filter and accept more short-term volatility in exchange for larger potential gains.
Invalidation levels: Every long signal needs a defined price level where the signal is considered false. Hitting that level before the expected move occurs is a clear exit trigger, regardless of your timeframe.
Top-down analysis: The most reliable approach is to identify the trend on a higher timeframe, spot the entry on an intermediate timeframe, and fine-tune risk and reward on a lower timeframe. This hierarchy keeps your trades aligned with the dominant market direction.
Aligning your trading style with the correct signal timeframe is not optional. A position trader acting on a 15-minute signal is operating outside the signal’s intended scope and will likely get shaken out by normal intraday volatility.
How do you identify and act on long signals using technology?
Technology has made identifying reliable long entry signals faster and more consistent. Manual chart reading still has value, but automated trade signal providers reduce false positives by integrating volume analysis, multi-timeframe confirmation, and consistent rule-based logic into a single output.
Core technical tools for identifying long signals:
Moving averages: A price crossing above a 50-period or 200-period moving average on strong volume is a classic long entry signal used across all asset classes.
Momentum oscillators: Tools like the Relative Strength Index (RSI) and MACD confirm whether price momentum supports a bullish move or is running out of steam.
Breakout volume analysis: Comparing current volume to the average volume over the prior 20 candles identifies whether a breakout has genuine participation behind it.
Multi-timeframe analysis frameworks: Top-down timeframe hierarchy is the professional standard. Identify the trend on the daily or weekly chart, then drop to the 4-hour or 1-hour chart for entry timing.
Big Move Algo applies this logic automatically. Its TradingView indicator analyzes real-time market data and outputs clear Long, Short, and Exit signals across crypto, forex, stocks, indices, and commodities. The built-in Fake Trend Detector filters out low-quality market conditions where a long signal would carry elevated false-positive risk. Traders can use automated signal benefits to remove emotional decision-making from the process entirely.
Pro Tip: Combine any long signal with a defined risk management rule before entering. Set your stop-loss at the invalidation level and size your position so that hitting the stop costs no more than 1–2% of your trading capital.
Key Takeaways
A valid long signal requires volume confirmation, multi-timeframe alignment, and open interest support. Relying on price alone produces false entries and avoidable losses.
Point | Details |
Long signal definition | A bullish entry signal indicating favorable conditions to buy or hold an asset. |
Volume confirmation | Breakout candles need 200–300% of average volume to confirm a true signal. |
Long Build Up strength | Simultaneous price and open interest increases signal stronger conviction than price alone. |
Timeframe alignment | Day, swing, and position trades each have specific windows where a signal remains valid. |
Technology advantage | Automated tools with multi-timeframe logic reduce false positives and improve signal reliability. |
Why most traders misread long signals until they slow down
The most common mistake I see traders make is treating a long signal as permission to buy immediately. A signal is a condition, not a command. The market does not owe you a move just because the indicators lined up.
What changed my own trading was learning to ask one question before every entry: “What would have to happen for this signal to be wrong?” That question forces you to identify the invalidation level before you enter, which is the single most protective habit a trader can build. Most traders skip that step entirely.
Single-indicator dependence is the other trap. A rising RSI on a 5-minute chart is not a long signal. It is one data point. A long signal is a story told by price, volume, open interest, and timeframe alignment together. When those four elements agree, the probability of a sustained move increases meaningfully. When only one or two agree, you are speculating, not trading.
The traders who use long signals most effectively also study the signals that failed. A false signal on a day trade that did not move within 4–8 hours teaches you more about market structure than three winning trades. Losing trades with good process are data. Winning trades with bad process are luck.
Patience is the skill that ties all of this together. The best long signals are obvious in hindsight because all the confirmation was there. The challenge is waiting for that full confirmation to appear before committing capital, rather than jumping in on the first sign of bullish momentum.
— Steven Hartwell
How Big Move Algo simplifies long signal detection
Identifying a reliable long signal manually takes time, discipline, and experience across multiple data sources. Big Move Algo condenses that process into a single, clear output directly on your TradingView chart.

The indicator scans price action, volume, and market structure in real time, then displays a Long signal when conditions meet its validated criteria. The Fake Trend Detector adds a layer of protection by flagging market conditions where signals carry higher false-positive risk. Traders new to the process can start with AUTO Mode for instant setup, while experienced traders can adjust parameters in Manual Mode. See how Big Move Algo works across crypto, forex, stocks, and more, and get access through a subscription plan with instant delivery after purchase.
FAQ
What does a long signal mean in trading?
A long signal means market conditions favor buying or holding an asset, based on a combination of price momentum, volume, and sentiment data. It reflects a bullish outlook supported by multiple confirming indicators.
How do I identify a valid long signal?
A valid long signal shows breakout candles with 200–300% of average volume, alignment across multiple timeframes, and rising open interest alongside price. Signals that lack volume confirmation or contradict the higher timeframe trend are likely false.
What is the difference between a long signal and a Long Build Up?
A basic long signal indicates bullish conditions based on price and momentum. Long Build Up is a stronger version where price and open interest rise simultaneously, confirming that fresh buyers are actively entering the market rather than short sellers simply closing positions.
How long is a long signal valid for?
Signal validity depends on your trading style. Day trade signals are valid for 4–8 hours, swing trade signals for 24–48 hours, and position trade signals for 5–10 days. If price fails to move in the expected direction within that window, the signal is considered false.
Can automated tools generate reliable long signals?
Yes. Automated tools that integrate volume analysis, multi-timeframe confirmation, and rule-based logic produce more consistent long signals than manual analysis alone. Big Move Algo is one example, applying real-time market scanning with a built-in filter for low-quality market conditions.
Recommended
Comments