
Stop Guessing Trend-Following Signals: 5 Rules Traders Use
- Steven Hartwell

- 16 hours ago
- 9 min read

Trend-following signals are rule-based triggers that commit capital only after a market shows measurable directional movement, not before. They combine indicators like moving averages, ADX, and MACD with sizing and exit rules so decisions get made systematically instead of emotionally. A trend is generally considered strong and tradable once ADX pushes above 25. Tools like Big Move Algo package that logic into direct Long, Short, and Exit alerts.
TL;DR:
Combining multiple components such as trend definition, entry and exit rules, position sizing, and risk controls creates a complete, systematic trading approach, not just a signal.
ADX above 25 serves as a filter indicating a strong trend, while indicators like MACD and RSI confirm momentum and trend strength, avoiding false signals.
Normalize for volatility using ATR and confirm conditions like volume and ADX to prevent entering trades during choppy or range-bound markets.
Use multi-timeframe analysis and strict filters beforehand, and backtest with realistic costs to avoid biases and improve long-term performance.
Big Move Algo simplifies the process by providing integrated alerts and screening for choppy conditions, suitable for diverse markets and easy to test on TradingView.
Table of Contents
What Trend-Following Signals Actually Are
A signal isn’t an indicator reading. It’s the output of a full system, and treating one moving average crossover as a “signal” is where most retail traders go wrong.
According to the SEC’s overview of rule-based trading approaches, trend following is a systematic method: traders enter in the direction of an established move rather than guessing at tops or bottoms. That systematic quality only shows up when five components are working together.
Trend definition: the rule that decides a trend exists (a moving average slope, a higher-high/higher-low pattern, or an ADX reading above a threshold).
Entry rule: the exact, unambiguous condition that triggers a buy or sell (a breakout close, a crossover, a momentum threshold).
Exit rule: a predefined way out, win or lose, so no trade is held on hope.
Position sizing: how much capital goes into the trade based on account risk, not gut feeling.
Risk controls: hard stops, maximum exposure limits, and rules for what happens during a losing streak.
Drop any one of these and the “signal” becomes a guess with extra steps. That’s four lines. It is also a complete trading plan, which is more than most indicator-only approaches ever produce.
The Core Trend-Following Indicators, Explained Plainly
Every popular trend indicator does one of two jobs: it defines the trend, or it confirms the trend has enough force behind it to trade. Mixing up which job an indicator is doing is a common, costly mistake.
Moving averages (SMA vs. EMA). A simple moving average weights every price equally; an exponential moving average weights recent prices more, so it reacts faster. Traders often use crossovers, like a 20-period EMA crossing above a 50-period EMA, as a trend-definition trigger. The tradeoff is lag: a moving average confirms a trend that’s already underway, never one that’s about to start.
ADX (Average Directional Index). ADX doesn’t tell you direction. It tells you strength, on a scale of 0 to 100.
ADX above 25 is the commonly cited benchmark for a strong, tradable trend, while readings under 20 to 25 signal a ranging market where trend-following setups tend to whipsaw. That single number functions as a filter more than a trigger: it tells you when to trust the other indicators and when to sit out entirely.
MACD (Moving Average Convergence Divergence). MACD has three parts: the MACD line, the signal line, and the histogram showing the gap between them. A MACD line crossing above its signal line is a common momentum-confirmation trigger, and it’s one of the four indicators traders reach for most often when building trend systems.
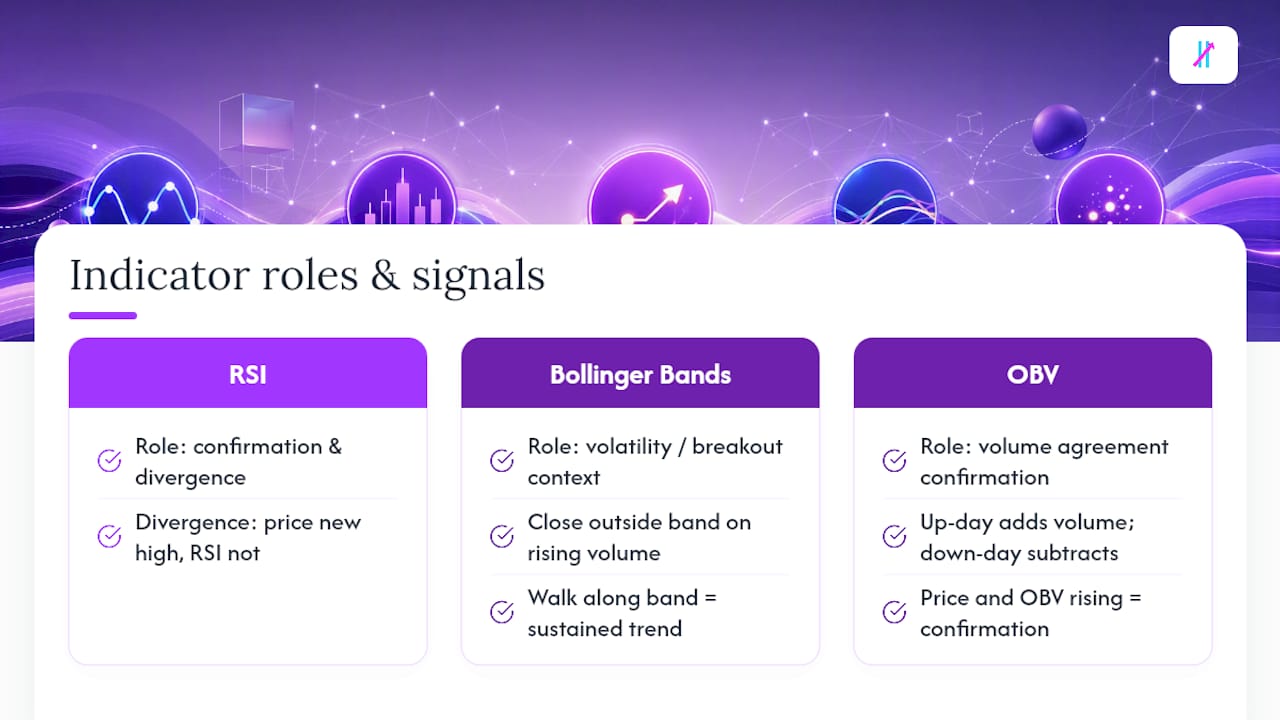
RSI (Relative Strength Index). In trend-following, RSI isn’t primarily used to call overbought or oversold. It’s used for confirmation and divergence, when price makes a new high but RSI doesn’t, that’s an early warning the trend is losing steam even though price hasn’t rolled over yet.
Bollinger Bands. These plot volatility bands around a moving average. A close outside the upper or lower band on rising volume often marks a breakout worth trading, while a “walk” along the band signals a trend with staying power.
OBV (On-Balance Volume). OBV adds volume on up days and subtracts it on down days. When price and OBV rise together, that agreement adds confirmation weight to a trend signal; when they diverge, the move is running on thinner support than the chart suggests.
Building Signals That Actually Hold Up
Stacking indicators without a framework just creates more noise to interpret. Practitioner research consistently points to combining a small indicator set with volatility normalization rather than adding more inputs.
Confirm across timeframes. Use a longer timeframe (weekly or daily) to define the trend’s direction, an intermediate one (4-hour or daily) to time the entry, and a shorter one only to fine-tune the exact fill. A signal that only appears on one timeframe is far more likely to be noise.
Normalize for volatility. A 2% move in a calm market and a 2% move in a volatile one aren’t equivalent. Using ATR (Average True Range) to size stops and position sizes keeps risk consistent as conditions change, which is a core reason volatility-adjusted rules outperform static ones across different markets, according to research on trend-following portfolio construction.
Filter for fake trends. Require ADX above 25, a volume uptick versus the recent average, and price outside its recent volatility band before treating a crossover as tradable. All three failing to align is usually the market telling you to wait.
A concrete combined rule: go long when price closes above the 50-EMA, ADX is above 25, and volume is above its 20-day average. Any one of those missing, skip the trade.
Pro Tip: Write your filter rules down before you look at a live chart. It’s much easier to be disciplined about ignoring a “close enough” setup when the threshold was set in advance, not in the heat of the moment.
Turning Signals Into Trades: Entry, Exit, and Sizing
A signal only matters once it becomes an executable trade plan. That means picking an entry template, an exit template, and a sizing method before the trade, not during it.
Entry templates traders actually use:
Breakout close: enter on the candle close beyond a defined range or resistance level, not on an intraday touch.
MA crossover with confirmation: a fast EMA crossing a slow EMA, filtered by an ADX or volume condition.
Momentum trigger: a MACD line crossing its signal line while RSI holds above the midline.
Exit templates that actually get used:
Opposite signal exit: close the trade when the entry condition reverses (the crossover flips back).
Volatility-adjusted trailing stop: trail a stop at a multiple of ATR, so the exit widens or tightens with actual market movement instead of a fixed dollar or percentage amount.
Maximum holding limit: a hard time-based exit if the trend hasn’t developed within a set number of bars, useful for avoiding capital getting stuck in a dead trade.
Trend-following research consistently treats the raw signal as the smallest piece of a larger system; volatility normalization, sizing, and portfolio-level risk limits do more to determine long-term results than the entry trigger itself.
None of this works without accounting for cost. Slippage on fast-moving breakouts, spread costs on lower-liquidity forex pairs, and margin financing on leveraged positions all quietly erode returns that look great on paper. A strategy that nets 8% annually before costs can turn flat or negative after them if position turnover is high, which is exactly why testing risk controls matters as much as testing the signal.
Setting This Up in TradingView (and How Big Move Algo Fits)
Most of what’s described above can be built directly on TradingView, and it’s worth walking through the practical steps before assuming you need custom code.
Stack your indicators on one chart. Add a moving average pair, ADX, and either MACD or RSI as a confirmation layer, keeping the chart legible rather than cluttered.
Set alert conditions, not just visual signals. TradingView alerts can trigger on crossovers, threshold breaks, or custom formulas, so the signal fires whether or not you’re staring at the screen.
Check a higher timeframe before acting. Pull up the daily or weekly chart manually before executing a signal that triggered on a 4-hour chart, confirming the intermediate signal doesn’t contradict the broader trend.
Test parameter sensitivity. Small changes to a moving average length or ADX threshold can shift results meaningfully; know how sensitive your rule set is before trading it live.
Big Move Algo builds much of that stacking into a single TradingView indicator, translating the combined-indicator logic into direct Long, Short, and Exit alerts rather than requiring traders to interpret four separate panels themselves. Its Fake Trend Detector applies the same filtering logic described above, screening for the low-quality, choppy conditions where ADX and volume disagree, before a signal is even issued.
AUTO Mode uses default parameters for traders who want signal calculations handled for them, while Manual Mode exposes the underlying settings for traders who want to adjust sensitivity to a specific market or timeframe. What still needs testing on your end: how the default parameters perform on the specific asset and timeframe you trade, and how the signals hold up across a backtest that includes real transaction costs.
Backtesting Without Fooling Yourself
A backtest that looks great and a strategy that survives live trading are two different things, and the gap between them is usually one of a few well-documented mistakes.
The standard workflow runs in three stages: a historical backtest on past data, an out-of-sample or walk-forward test on data the rules were never tuned against, and a final check with realistic costs, spread, slippage, and financing, layered in. Skipping the walk-forward step is the single most common reason a promising backtest fails to survive first contact with live markets.
Three biases wreck naive backtests specifically:
Look-ahead bias: accidentally using information that wasn’t available at the time of the signal (like an indicator value calculated on a candle’s close before the candle closed).
Survivorship bias: testing only on assets or setups that happened to survive and perform well, while ignoring the ones that got delisted or failed.
Overfitting: tuning parameters so precisely to historical data that the strategy has effectively memorized the past instead of capturing a repeatable pattern, a risk that testing methodology research flags as one of the most common ways backtests mislead traders.
Trend-following also has a known weak spot: sideways, low-volatility markets. When ADX sits under 20 for extended stretches, moving average crossovers fire constantly and reverse just as fast, the textbook definition of whipsaw. The tactical adjustment most traders make is widening entry filters, reducing position size, or simply standing aside until ADX confirms trend conditions have returned.
What I’ve Learned Applying These Signals in Practice
The hardest part of trend following isn’t finding a good signal. It’s sitting through the losing trades a good system is designed to produce, and doing it without touching the rules mid-drawdown.
What frustrates practitioners most isn’t a bad indicator, it’s a good signal that gets overridden by impatience three bars before it would have worked. Volatility-adjusted stops and a hard position-sizing cap take some of that decision out of your hands during rough stretches, which is the point.
Start smaller than feels necessary. Run signals through paper trading or minimal size on live alerts before scaling up, and expect the first few months to be about validating the rules, not making money. That order matters more than most traders want to admit.
— Steven Hartwell
Try Big Move Algo on Your Own Charts
Reading five indicators across three timeframes takes practice most traders never get around to finishing. Big Move Algo compresses that work into one TradingView indicator that outputs direct Long, Short, and Exit alerts, backed by a Fake Trend Detector that screens out the choppy, low-ADX conditions covered above.

AUTO Mode gets you running with sensible defaults in minutes; Manual Mode opens up the same parameters discussed in this guide (moving average length, ADX threshold, volatility filters) for traders who want to tune signals to a specific market. It works across crypto, forex, stocks, indices, and commodities, delivers alerts to multiple platforms, and supports unlimited devices under one subscription. Backtest it against your own chart history on TradingView before committing real size, the same discipline this whole article argues for.
This article is general information, not a substitute for advice from a qualified financial advisor. Consult a qualified financial professional about your own circumstances before acting on anything here.
Sources
Recommended
Comments