
ATR Stop Loss: Practical Defaults and Worked Examples


Set an ATR stop by placing your stop distance equal to ATR × multiplier, then confirm the level sits beyond nearby structure and size the position so your dollar risk stays within your limit. For a long position: Stop Price = Entry Price − (ATR × Multiplier). For a short: Stop Price = Entry Price + (ATR × Multiplier).
Quick multiplier defaults by timeframe:
Scalping (M1–M5): 0.75–1.25× ATR
Day trading (M15–H1): 1–1.5× ATR
Swing trading (H4–Daily): 1.5–2.5× ATR
Trend-following (Weekly): 2–3× ATR
Pro Tip: ATR gives you the distance; price structure gives you the location. Always check that your computed stop sits beyond a swing high or low, not just floating in open space. A stop that lands mid-range between two support levels is a stop that gets hunted.
Key Takeaways
ATR(14) with a multiplier of 1.5–2× is the most practical starting point for most retail traders, but the multiplier must be backtested per instrument before live trading.
Point | Details |
Core formula | Stop Distance = ATR × Multiplier; long stop = Entry − distance, short stop = Entry + distance. |
Default settings | ATR(14) suits most styles; use 1–1.5× for day trades, 1.5–2.5× for swing trades. |
Position sizing | Size = Risk Amount ÷ (Stop Distance × Value per Unit); recalculate every trade as ATR changes. |
Confirm with structure | Always verify the computed stop sits beyond a swing high or low, not in open space. |
Big Move Algo | Automates ATR-based exit logic with a Fake Trend Detector to filter choppy, low-quality signals. |
Table of Contents
Why does an ATR stop loss outperform fixed-pip stops?
The Average True Range, typically calculated over 14 periods (ATR(14)), measures how much an asset actually moves per candle, accounting for gaps and overnight ranges. It is a volatility metric, not a direction signal. When volatility contracts, ATR shrinks and your stop tightens. When volatility expands, ATR widens and your stop breathes with the market.
Fixed-pip or fixed-percentage stops ignore this entirely. A 20-pip stop on EUR/USD during a quiet London morning is reasonable. That same stop during a Non-Farm Payrolls release is noise-level, and you will be stopped out before the real move even starts. A fixed 2% stop on a stock has the same problem: it means nothing different during a low-volatility earnings drift versus a high-beta sector rotation.
The practical benefits of volatility-adjusted stops are concrete:
Noise immunity: The stop sits outside the typical candle range, so random intraday fluctuation does not trigger it.
Dynamic sizing: As ATR changes, your stop distance changes, and your position size adjusts to keep dollar risk constant.
Consistent risk control: You are always risking a defined amount relative to how the market is actually behaving, not relative to an arbitrary number you picked last month.
Fixed stops can fail in two specific ways: they are too tight during high-volatility periods (stopping you out of valid trades) and too wide during low-volatility periods (risking more than necessary when the market is calm). ATR-based stops solve both problems simultaneously.
What ATR stop strategies should you know?
There are four main methods. Each fits a different trading style, and knowing which one matches your edge saves a lot of trial and error.
Basic ATR stop: A fixed stop placed at Entry ± (ATR × Multiplier) at the time of entry. It does not move after placement. Best for day traders and scalpers who close positions within the session. Typical multiplier: 1–1.5×.
ATR trailing stop: The stop moves in the direction of the trade as price makes new highs (for longs) or new lows (for shorts), but never moves against you. StockCharts ChartSchool describes the calculation: multiply ATR by a user-defined factor, then subtract from the highest close reached (for longs) or add to the lowest close (for shorts). The stop only updates when price moves favorably. Best for swing and trend traders. Typical multiplier: 1.5–2.5×.
Chandelier Exit: A trailing stop anchored to the highest high of the trade (not the highest close). QuantifiedStrategies notes that Chandelier-style exits often use multipliers of 3–3.5× ATR to survive larger pullbacks in trending markets. Best for trend-following on daily or weekly charts.
ATR % stop: Instead of using the full ATR value, you use a percentage of it. Investopedia’s stop placement guide gives a clear example: a day trader might use 10% of ATR (roughly 11–14 pips on a 2006 GBP/USD sample), while a swing trader uses 50–100% of ATR (75–90 pips on the same pair). Best for traders who want finer control over stop distance without changing the multiplier logic.
Pro Tip: Combine any of these methods with a trend filter. If price is above the 20 EMA, only take long ATR stops. If below, only short. This single filter cuts the number of stops that get hit on counter-trend noise by a meaningful margin, and it keeps you aligned with the structure that actually matters.
How to calculate an ATR stop: two worked examples
Step-by-step calculation
Open your chart on the entry timeframe and read the current ATR(14) value from the indicator panel.
Choose your multiplier based on your trading style (see the defaults above).
Compute stop distance: Stop Distance = ATR × Multiplier.
For a long entry: Stop Price = Entry Price − Stop Distance.
For a short entry: Stop Price = Entry Price + Stop Distance.
Confirm the stop sits beyond a nearby swing high or low. If it does not, either widen the multiplier slightly or skip the trade.
Worked example A: day trade on EUR/USD (M15 chart)
ATR(14) on M15 = 0.0012 (12 pips)
Multiplier: 1.5× (day trading default)
Stop distance: 0.0012 × 1.5 = 0.0018 (18 pips)
Entry (long): 1.0850
Stop price: 1.0850 − 0.0018 = 1.0832
Check: nearest swing low is at 1.0830. The stop at 1.0832 sits just above it, which is too close. Adjust multiplier to 1.6×: Stop = 1.0850 − 0.00192 = 1.0831. Still marginal. Move to 1.7×: Stop = 1.0830 − 0.001 = 1.0830. In practice, place the stop one or two pips below the swing low at 1.0828 to account for spread.
Worked example B: swing trade on S&P 500 (Daily chart)
ATR(14) on Daily = 45 points
Multiplier: 2× (swing trading default)
Stop distance: 45 × 2 = 90 points
Entry (long): 5,200
Stop price: 5,200 − 90 = 5,110
Dollar risk per share: $90
Target dollar risk: $500 per trade
Position size: $500 ÷ $90 = 5.5 shares → round down to 5 shares
TradingToBeRich advocates ATR(14) × 1.5 as a practical default for many traders, with the multiplier tested per market before going live.
Position-size conversion formula
Size = Dollar Risk ÷ (ATR × Multiplier × Dollar Value per Point)
For forex (standard lot = $10/pip on EUR/USD): if your stop is 18 pips and your max loss is $100, then Size = $100 ÷ (18 × $10) = 0.56 lots → round to 0.5 lots. ForexTradeLab stresses treating ATR as a volatility unit to scale both stops and position size so dollar risk stays constant as volatility changes.
Which ATR period and multiplier should you use?
ATR(14) is the right starting point for most traders. It is the Wilder default, it is available on every platform, and it smooths out enough noise without lagging too far behind recent volatility. Shorter periods like ATR(7) react faster and suit scalpers who need a stop that tracks intraday volatility closely. Longer periods like ATR(20) or ATR(50) suit position traders who want a stop that reflects multi-week volatility rather than a single session’s range.
Trading Style | Timeframe | ATR Period | Multiplier Range | Notes |
Scalping | M1–M5 | ATR(7–10) | 0.75–1.25× | Tighten for liquid pairs; widen for crypto |
Day trading | M15–H1 | ATR(14) | 1–1.5× | Add spread to stop distance |
Swing trading | H4–Daily | ATR(14) | 1.5–2.5× | Confirm beyond swing high/low |
Trend-following | Daily–Weekly | ATR(14–20) | 2–3× | Chandelier Exit suits this style |
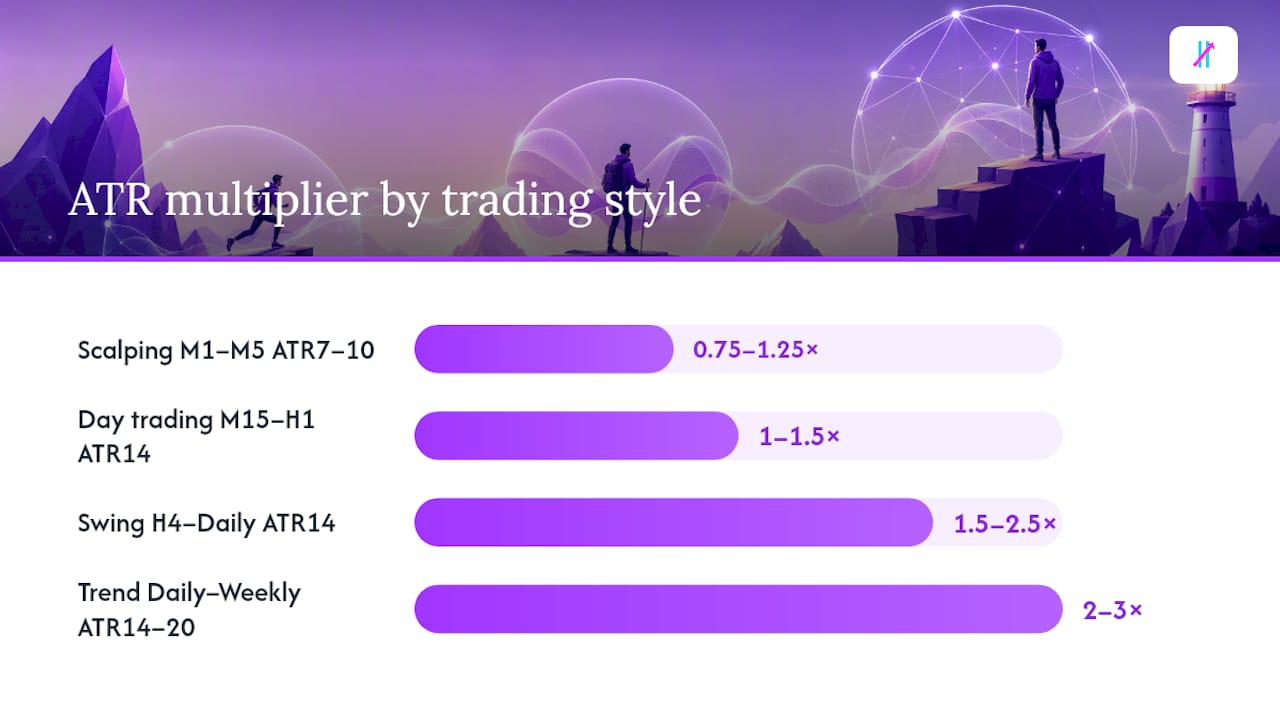
ForexTradeLab’s multiplier guidance aligns with these ranges and adds a critical point: ATR does not replace market structure, and position size must be reduced if stops widen.
A few practical adjustments worth making:
Volatile assets (crypto, small-cap stocks): Push the multiplier toward the upper end of the range. A 1× ATR stop on Bitcoin during a high-volatility week will be hit constantly.
Tight-spread majors (EUR/USD, SPY): The lower end of the multiplier range works fine because spread is minimal relative to ATR.
News events: Widen ATR period to ATR(20) temporarily, or skip the trade. ATR(14) may understate true risk when a major release is imminent.
Pro Tip: Run a quick backtest on your specific instrument before committing to a multiplier. What works on EUR/USD at 1.5× may underperform on GBP/JPY at the same setting. The multiplier is a starting hypothesis, not a universal constant.
How do you place ATR stops in a live trading platform?
Order types and when to use them
Market stop order: Triggers at your stop price and fills at the next available market price. Simple and reliable in liquid markets, but slippage can be significant during news or thin sessions.
Stop-limit order: Triggers at your stop price but only fills at your limit price or better. Protects against slippage but risks no fill if price gaps through your limit. Use in liquid markets where gaps are rare.
Trailing stop order: Many brokers let you enter a trailing stop in dollar or pip terms. Set the trail amount equal to your ATR × Multiplier distance and the broker’s system updates the stop automatically. Useful for swing trades where you do not want to monitor the chart constantly.
Implementing ATR stops in TradingView
Add the ATR indicator: click “Indicators,” search “ATR,” select the built-in Average True Range, set period to 14.
Read the ATR value from the indicator panel at your entry candle.
Multiply by your chosen multiplier and calculate the stop price manually.
Draw a horizontal line at the stop price using TradingView’s drawing tools for visual reference.
Enter the stop price in your broker’s order ticket (most brokers integrate directly with TradingView via the broker panel).
For a trailing stop, update the stop level manually each time price makes a new favorable extreme, or use a TradingView indicator that plots the trailing stop automatically.
Platform-specific parameters matter. Tastytrade’s ATR trailing stop documentation lists configurable inputs including trail type, ATR period, ATR factor, and average type (Wilder, EMA, Hull), which affect the stop output. StockCharts defaults to ATR(21) with a multiplier of 3 on their platform, which is worth knowing if you are reading someone else’s chart.
Pro Tip: Place stops at least one ATR unit away from obvious round numbers and swing levels that every trader can see. A stop sitting exactly at a round number like 1.0800 or $200.00 is a magnet for stop-hunting algorithms. Offset by a few pips or cents beyond the obvious level.
How does ATR stop distance control your position size?
The stop distance is not just a risk level. It is the primary input for sizing every trade. When ATR expands, your stop widens, and if you keep the same share count or lot size, your dollar risk grows. The fix is to reduce position size proportionally.

Position-size formula:
Size = Risk Amount ÷ (Stop Distance × Value per Unit)
Worked example with a $100 maximum loss:
ATR(14) on a stock = $2.50
Multiplier: 2× → Stop distance = $5.00
Risk amount: $100
Size = $100 ÷ $5.00 = 20 shares
If ATR expands to $4.00 the next week (same stock, higher volatility):
Stop distance = $4.00 × 2 = $8.00
Size = $100 ÷ $8.00 = 12.5 shares → 12 shares
The dollar risk stays near $100 in both cases. Without the size adjustment, you would be risking $160 on the same trade setup simply because the market got noisier.
Key risk-management rules to apply alongside ATR sizing:
Risk no more than 1–2% of account equity per trade. On a $10,000 account, that is $100–$200 maximum loss per position.
When ATR expands sharply (e.g., ahead of earnings or a Fed meeting), reduce size or skip the trade entirely. The stop will be wide, and even a 1% risk rule may produce an uncomfortably large position.
Avoid trading when spreads spike to more than 20–30% of ATR. At that point, you are paying a significant portion of your stop distance just to enter the trade.
What are the real pros, cons, and mistakes with ATR stops?
Pros:
Adapts to actual market volatility rather than an arbitrary fixed number.
Objective and repeatable: two traders using ATR(14) × 1.5 on the same chart get the same stop.
Ties stop placement directly to position sizing, making risk control systematic.
Cons:
ATR is a lagging indicator. It reflects past candles, not the volatility of the next candle. During sudden news spikes, ATR(14) may significantly understate true risk.
Wide stops in high-volatility environments can produce large position-size reductions that frustrate traders used to trading fixed sizes.
QuantifiedStrategies notes that higher multipliers (3–3.5×) used in Chandelier-style exits can produce very wide stops that test patience during long trending phases.
Common mistakes and how to fix them:
Using ATR without structure: Placing a stop purely at Entry − (ATR × Multiplier) without checking whether a swing low sits nearby. Fix: always confirm the stop is beyond a structural level.
Ignoring spread: On forex pairs with wide spreads (exotic pairs, off-hours), the spread alone can eat 30–50% of a tight ATR stop. Fix: add the spread to your stop distance calculation.
Failing to adjust position size when ATR widens: The most common mistake. Fix: recalculate size every time you enter a new trade using the current ATR value, not last week’s.
Using ATR blindly across assets: A 1.5× multiplier that works on EUR/USD may be far too tight on Bitcoin or a small-cap stock. Fix: backtest the multiplier on each instrument separately before trading it live.
Trading through major news with ATR stops: ATR(14) cannot price in a surprise CPI print. Fix: close or reduce positions before scheduled high-impact releases, or widen to ATR(20) and cut size.
How Big Move Algo uses volatility-based exits
Inside Big Move Algo, ATR-based logic runs alongside trend filters to reduce the false exits that plague raw ATR trailing stops in choppy markets. The built-in Fake Trend Detector identifies low-quality market conditions where ATR stops tend to whipsaw, and it suppresses signals during those periods rather than letting traders enter trades where the stop is likely to be hit by noise rather than a genuine reversal.
In AUTO Mode, the indicator handles stop and exit logic automatically, which suits traders who want a structured system without manually recalculating ATR levels on every candle. Manual Mode gives experienced traders the ability to adjust parameters, including how aggressively the exit logic trails price, making it useful for applying ATR-based exits across different timeframes and asset classes.
Big Move Algo works across crypto, forex, stocks, indices, and commodities, which matters because ATR multipliers need to be calibrated per asset. The cross-market design means the indicator’s exit logic is tested across different volatility regimes, not just one instrument. That said, no indicator removes the need to verify ATR parameters on your own historical data before trading live.
Big Move Algo automates the ATR logic so you do not have to

Calculating ATR stops manually on every trade is straightforward once you know the formula, but doing it consistently under live market pressure is where most traders slip. Big Move Algo’s TradingView indicator handles the volatility-based exit logic in real time, surfacing clear Long, Short, and Exit signals without requiring you to run the numbers yourself on every candle.
The Fake Trend Detector filters out the low-quality setups where ATR stops get whipsawed most often. AUTO Mode gets you trading immediately with sensible defaults; Manual Mode lets you dial in the parameters once you have backtested your preferred multiplier on your instrument. Alerts fire across multiple platforms so you never miss an exit signal.
Automation does not remove risk. Always backtest your ATR settings on historical data for your specific market and timeframe before going live, and keep position sizing discipline regardless of what the indicator signals. Visit Bigmovealgo to see the subscription plans and get started.
Sources
These sources go deeper on specific aspects of ATR stop placement and trailing stop mechanics:
This article is general information, not a substitute for advice from a qualified financial advisor. Consult a qualified financial professional about your own circumstances before acting on anything here.
Recommended
Comments