
Best Charting Platform for Active Traders in 2026


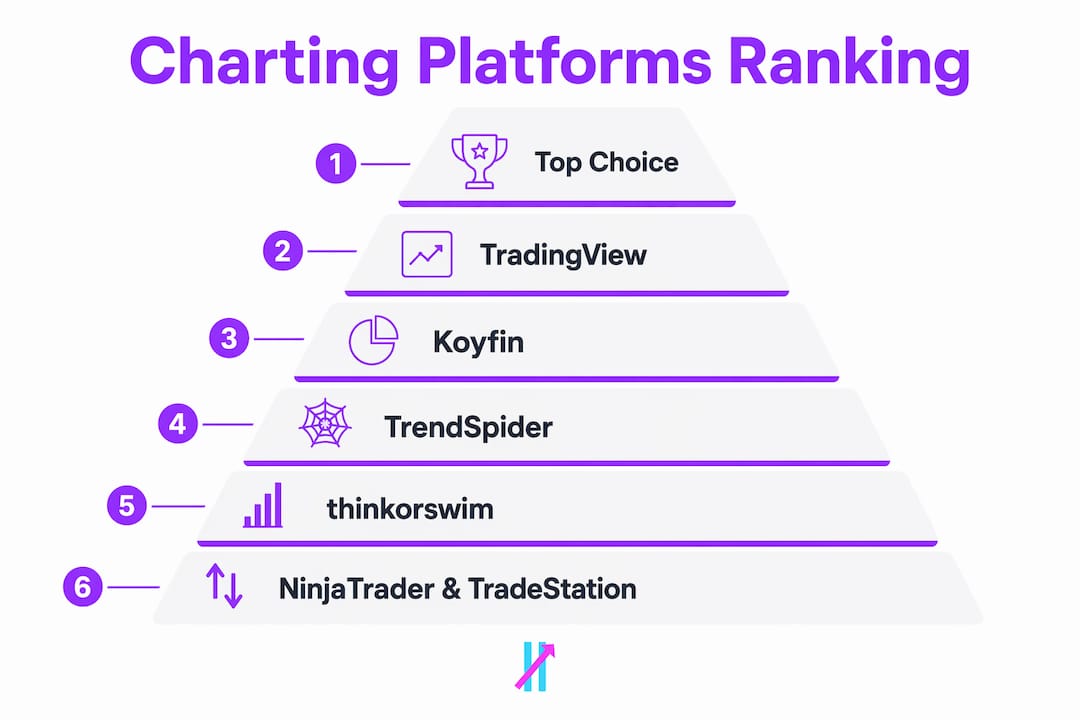
For most active retail traders, TradingView is the default answer. It covers the widest range of markets, hosts thousands of community-built indicators, and supports Pine Script for custom strategies. But the “best charting platform” depends heavily on what you actually do: options traders often prefer thinkorswim (now on Schwab), futures system builders lean on NinjaTrader or TradeStation, and fundamental investors get more out of Koyfin or TIKR than any pure chart tool.
Here’s the fast shortlist:
TradingView — Best overall for active technical traders; free tier available, paid plans from ~$14.95/month
thinkorswim (Schwab) — Best for options traders and brokerage-integrated workflows; free with a Schwab account
TrendSpider — Best for automation, rule-based scanning, and backtesting; premium pricing (~$39/month+)
Koyfin — Best for fundamental and macro research; free tier available, paid plans from ~$19/month
NinjaTrader — Best for futures traders and system developers; free platform, data/brokerage fees apply
Big Move Algo — Best signal overlay for traders who want clear Long/Short/Exit signals directly on TradingView charts, without building their own strategy from scratch
Stat to know: Review roundups consistently rank TradingView as the top stock charting app overall, citing its community indicator ecosystem as the primary differentiator.
Table of Contents
Why TradingView is the default choice for most active traders
What makes Koyfin the right pick for fundamentals and macro research
Why TrendSpider appeals to traders who want automation and repeatable systems
How thinkorswim fits traders who want brokerage-native charting and options tools
NinjaTrader and TradeStation: built for futures traders and system developers
StockCharts, Finviz, Yahoo Finance, TIKR, and Stock Rover: when to use each
How do you choose the right charting platform for your trading style?
Why some traders prefer a focused signal overlay like Big Move Algo
Which charting platforms compare best side by side?
The table below covers all 12 platforms across the dimensions that matter most to active traders. Pricing reflects publicly listed tiers; free tiers are noted where available.
Platform | Best For | Pricing / Free Tier | Real-Time Data | Indicators & Strategies | Backtesting & Automation | Customization / Scripting | Alerts & Mobile | Ease of Use |
Signal-overlay on TradingView; reducing analysis paralysis | Subscription (Stripe); free trial available | Via TradingView subscription | Long/Short/Exit signals, Fake Trend Detector, AUTO/MANUAL modes | Integrates with TradingView automation | TradingView overlay; no scripting required | Multi-platform alerts; unlimited devices | Very easy (AUTO Mode) | |
Active technical traders; multi-market charting | Free tier; paid from ~$14.95/mo | Real-time on paid plans; delayed on free | 100k+ community scripts, Pine Script | Strategy tester built in | Pine Script; largest community library | Strong alerts; iOS/Android apps | Moderate | |
Koyfin | Fundamental & macro investors | Free tier; paid from ~$19/mo | Delayed on free; real-time on paid | Macro dashboards, fundamental overlays | Limited | Dashboard customization | Email/browser alerts; mobile app | Easy to moderate |
TrendSpider | Automation, scanning, backtesting | From ~$39/mo; no free tier | Real-time included | Pattern detection, multi-timeframe scans | Advanced rule-based backtesting | Raindrop charts; scripted scans | Alerts; mobile app | Steep learning curve |
thinkorswim (Schwab) | Options traders; broker-integrated workflow | Free with Schwab account | Real-time | —, options analytics | thinkScript strategy testing | thinkScript scripting | Strong alerts; mobile app | Complex |
NinjaTrader | Futures traders; system builders | Free platform; data/brokerage fees apply | Real-time (data feed required) | 100+ indicators; NinjaScript | Advanced automated strategy engine | NinjaScript (C#-based) | Alerts; desktop-focused | Steep |
TradeStation | Semi-pro strategy testing; direct execution | Brokerage account required | Real-time | EasyLanguage strategies | Robust backtesting engine | EasyLanguage scripting | Alerts; mobile app | Moderate to steep |
Long-term technical traders; overlays | Free limited; paid from ~$19.95/mo | Delayed on free; real-time on paid | Large overlay library, ACP | Limited | Layout saving; alerts | Alerts; mobile-friendly | Easy to moderate | |
Finviz | Quick screening; heatmaps | — | Delayed on free; real-time on Elite | Screener filters; basic charts | None | Screener alerts | Email alerts; no dedicated app | Very easy |
Yahoo Finance | Casual investors; news + basic charts | Free | Delayed | Basic indicators | None | Minimal | Watchlist alerts; mobile app | Very easy |
TIKR | Deep fundamental research | Free tier; paid from ~$20/mo | Delayed/fundamental focus | Financial data overlays | None | Dashboard customization | Limited | Easy |
Stock Rover | Portfolio analysis; metric-driven screening | Free tier; paid from ~$7.99/mo | Delayed on free | Screening metrics, portfolio charts | Limited | Metric-based screening | Alerts; web-based | Easy to moderate |
A few quick notes on pricing shape: TradingView’s free tier provides delayed data and limits on alerts, which is fine for learning but not for live trading. thinkorswim costs nothing beyond a Schwab brokerage account, making it one of the best value propositions in the category. NinjaTrader’s platform is free, but real-time futures data requires a paid feed.
Why TradingView is the default choice for most active traders
TradingView built its dominance on three things: market breadth, community, and extensibility. You can chart stocks, forex, crypto, futures, and indices from a single interface, switch between them in seconds, and pull up a community-built indicator for almost any strategy you can name. The community script library alone has grown to over 100,000 published indicators, which means most traders never need to write a single line of Pine Script.
That said, TradingView’s free tier has real limits. Data is delayed, alerts are capped, and you can only have a handful of indicators per chart. For live trading, you’ll want at least the Essential plan. Real-time data for specific exchanges often costs extra on top of the subscription, which catches new users off guard.
Pros: Widest market coverage, massive community library, Pine Script for custom strategies, clean web interface, strong mobile app.
Cons: Real-time data add-ons can push costs higher than expected; the platform doesn’t execute trades natively (you need a connected broker or a separate execution path).
Best for: Active technical traders who want maximum flexibility, community scripts, and multi-market coverage in one place. It’s also the foundation that signal overlays like Big Move Algo are built on.
What makes Koyfin the right pick for fundamentals and macro research
Koyfin sits in a different category than most charting tools. Where TradingView is built around price action and technical analysis, Koyfin is built around data: earnings estimates, revenue trends, macro indicators, and cross-asset dashboards. If you’re the kind of investor who wants to see a company’s free cash flow growth alongside its price chart, Koyfin makes that easy. Most pure charting platforms make it painful.

The free tier is genuinely useful for basic research, but the real value shows up in paid plans, where you get real-time data, more dashboard slots, and deeper fundamental datasets. The trade-off is clear: Koyfin doesn’t support order execution, Pine Script, or advanced technical scanning. It’s a research tool, not a trading terminal.
Best for: Fundamental investors and macro analysts who want integrated dashboards. If you’re running a discretionary equity strategy and need earnings data, sector comparisons, and macro overlays in one place, Koyfin is worth the subscription.
Pro Tip: Use Koyfin for your pre-trade research and TradingView for your chart-level entry timing. The two complement each other well, and both have free tiers you can test before committing.
Why TrendSpider appeals to traders who want automation and repeatable systems
TrendSpider’s core pitch is automation: you define rules, and the platform scans for them. Multi-timeframe analysis, automated trendline detection, and rule-based backtesting are all built in. For traders who want to test whether a pattern actually works before trading it live, that’s a meaningful advantage over platforms where backtesting is an afterthought.

The downsides are cost and complexity. TrendSpider doesn’t offer a free tier, and the learning curve is real. You’ll spend time learning the scanning interface before you get useful results.
Key strengths:
Multi-timeframe scanning: Scan for setups across multiple timeframes simultaneously without manually switching charts
Automated trendline detection: The platform draws trendlines algorithmically, reducing subjective bias
Rule-based backtesting: Build a strategy in plain-language rules and test it against historical data
Raindrop charts: A proprietary chart type that combines volume and price action in a single visual
Best for: Traders who run systematic or semi-systematic strategies and want to validate setups before going live. Not the right choice if you want a simple, low-cost charting environment.
How thinkorswim fits traders who want brokerage-native charting and options tools
thinkorswim, now part of Schwab’s platform suite, is one of the few charting environments where you can analyze a complex options position and execute it without leaving the screen. The options analytics alone, including probability cones, risk profiles, and multi-leg order builders, are more sophisticated than anything you’ll find on a standalone chart platform.
The catch is portability. Your charts, studies, and thinkScript strategies live inside the Schwab ecosystem. If you ever move to a different broker, you start over. The platform is also genuinely complex: new users often spend weeks learning the interface before they feel comfortable.
Pro Tip: thinkorswim’s paper trading mode is one of the best in the industry. Use it to test your chart setups and options strategies with real market data before risking capital.
Best for: Active options traders and anyone who wants a single platform for charting, analysis, and execution. If you’re trading equities only and don’t need broker integration, TradingView gives you more flexibility at a lower cost.
NinjaTrader and TradeStation: built for futures traders and system developers
These two platforms occupy the same professional tier, but they serve slightly different needs.
NinjaTrader is the go-to for futures traders who want low-latency execution and automated strategy deployment. The platform is free to use for charting and backtesting; you pay when you go live through their brokerage or connect a third-party data feed. NinjaScript (C#-based) gives developers full control over strategy logic, order routing, and execution. The community marketplace also has hundreds of third-party add-ons.
TradeStation offers a similar depth of strategy development through EasyLanguage, its proprietary scripting language, plus direct market access for equities, futures, and options. It’s particularly strong for traders who want to run a fully automated system with direct execution and don’t want to manage a separate broker connection.
Both platforms share a few characteristics worth knowing:
Neither has a meaningful free tier for live trading
Both require a brokerage account or data subscription to access real-time feeds
The learning curve for scripting (NinjaScript or EasyLanguage) is steep compared to Pine Script
Mobile apps exist but are secondary; these are desktop-first platforms
Best for: Futures traders, systematic traders, and developers who need professional-grade execution and automation. Retail traders who primarily want clean charts and signals will find both platforms over-engineered for their needs.
StockCharts, Finviz, Yahoo Finance, TIKR, and Stock Rover: when to use each
These five platforms each do one thing well. Here’s where they fit:
StockCharts: The Advanced Charting Platform (ACP) offers a large library of technical overlays and flexible web-based layouts. Best for long-term technical traders who want pre-built chart styles and don’t need order execution. Free tier is limited; paid plans unlock real-time data and more chart slots.
Finviz: The fastest screener in this group. The heatmap view alone is worth bookmarking for a quick read on sector rotation. Finviz Elite adds real-time data and more alert options. Not a charting platform in the traditional sense, but an excellent idea-generation tool.
Yahoo Finance: Free, accessible, and integrated with news. The charts are basic, but for a casual investor who wants to check a stock’s price history alongside earnings headlines, it works fine. Don’t expect advanced indicators or reliable alerts.
TIKR: Institutional-style fundamental data at a retail price. If you need 10 years of income statement data, segment breakdowns, and consensus estimates in one place, TIKR delivers. Charts are secondary; this is a research database.
Stock Rover: Portfolio-focused screening with integrated charting. The metric-driven screener lets you filter by valuation, growth, and quality factors simultaneously. Best for investors managing a multi-position portfolio who want to track performance and screen for new ideas in one tool.
How do you choose the right charting platform for your trading style?
The honest answer is that most traders pick a platform based on what they see other traders using, then spend months realizing it doesn’t fit their workflow. A cleaner approach is to answer five questions first:
What markets do you trade? Futures traders need NinjaTrader or TradeStation. Crypto-heavy traders need TradingView’s broad exchange coverage. Options traders need thinkorswim.
Do you need broker integration? If you want to execute trades from your chart, thinkorswim or TradeStation are the natural choices. TradingView supports broker connections (Interactive Brokers, Tradovate, and others), but it’s not native.
How important is real-time data? Free tiers on most platforms deliver delayed data (typically 15–20 minutes). If you’re day trading, delayed data is not usable. Budget for a real-time data subscription.
Do you need backtesting or automation? TrendSpider for rule-based scanning, NinjaTrader or TradeStation for full strategy automation, TradingView’s Strategy Tester for Pine Script strategies.
What’s your budget? TradingView and Koyfin both have usable free tiers. thinkorswim is free with a Schwab account. TrendSpider, NinjaTrader (live), and TradeStation all require paid commitments.
Red flags to watch for: platforms that charge separately for every exchange’s real-time feed (costs add up fast), alert systems that lag by minutes (useless for day trading), and platforms with no export or API access if you plan to automate.
For multi-platform trading workflows, the practical advice is to separate your research tool from your execution tool. Use TradingView or Koyfin for analysis, and route execution through your broker’s native platform or API.
How we evaluated these platforms
The evaluation covered eight dimensions: market coverage and data latency, indicator depth and scripting capability, backtesting and automation quality, customization options, alert reliability and mobile functionality, broker integration and execution path, ease of use for active retail traders, and pricing transparency.
Testing notes focused on real-world trading workflows rather than feature checklists. Specifically:
Speed and responsiveness: How quickly charts load on a standard broadband connection, and whether alerts fire within a reasonable window of the signal
Alert reliability: Whether alerts arrive consistently and with low latency across email, SMS, and push notification channels
Mobile functionality: Whether the mobile app supports the core workflow (chart review, alert management, basic order entry) or is just a price-check tool
Community and support: Size and quality of the community script library, documentation depth, and responsiveness of support channels
Data sources: Whether the platform uses a proprietary feed or a third-party provider, and how that affects latency and cost
The shortlist was derived by weighting execution-readiness and workflow fit most heavily, since those are the dimensions that separate a useful trading tool from a feature-rich demo. Platforms that scored well on chart depth but poorly on alert reliability or data latency were ranked lower for active traders, even if they looked impressive on a spec sheet.
Market analysts note that matching chart complexity to trader experience is one of the most overlooked factors in platform selection. A cleaner, simpler chart often outperforms a heavily layered one for decision speed.
Why some traders prefer a focused signal overlay like Big Move Algo
Most charting platforms give you the tools to build a strategy. Big Move Algo gives you the output: a clear Long, Short, or Exit signal, directly on your TradingView chart, without requiring you to configure 12 indicators first.
The product is a TradingView indicator that overlays signals on any chart you’re already watching. AUTO Mode requires minimal setup and works across crypto, forex, stocks, indices, and commodities. MANUAL Mode lets more experienced traders adjust parameters to match their strategy. The Fake Trend Detector filters out low-quality signals during choppy or sideways market conditions, which is where most indicator-based systems generate their worst trades.
Key features at a glance:
Long, Short, and Exit signals displayed directly on the chart
AUTO Mode for quick setup; MANUAL Mode for customization
Fake Trend Detector to reduce noise in low-quality market conditions
Multi-market coverage: crypto, forex, stocks, indices, commodities
Unlimited device access; alerts delivered across multiple platforms
Compatible with automated trading integrations
The integration path is straightforward. Because Big Move Algo runs inside TradingView, you get TradingView’s full alert infrastructure: webhook alerts, email, SMS, and push notifications. If you’re using a broker API or an automation tool like 3Commas, you can route those alerts directly into your execution system.
Pro Tip: Use Big Move Algo’s Fake Trend Detector as a filter, not just a warning. When it flags a low-quality condition, treat that as a signal to stay flat, not to look harder for a trade. Fewer trades in bad conditions is a feature, not a limitation.
Professionals who study trading behavior consistently find that analysis paralysis from too many indicators is one of the most common performance killers for retail traders. A signal overlay that reduces the decision to a single, clear output addresses that directly.
Key Takeaways
TradingView is the strongest all-around charting platform for active retail traders, but the right choice depends on your markets, execution needs, and whether you want to build a strategy or trade a pre-built signal.
Point | Details |
TradingView leads the field | Widest market coverage, 100k+ community scripts, and Pine Script make it the top pick for active technical traders. |
Match platform to workflow | Options traders need thinkorswim; futures system builders need NinjaTrader or TradeStation; fundamental investors get more from Koyfin or TIKR. |
Free tiers have real limits | Most free tiers deliver delayed data, which is not usable for day trading; budget for a real-time data subscription. |
Automation requires the right tool | TrendSpider for rule-based scanning, NinjaTrader/TradeStation for full strategy automation, TradingView Strategy Tester for Pine Script. |
Big Move Algo simplifies the signal layer | For traders who want clear Long/Short/Exit signals on TradingView without building their own strategy, Big Move Algo is the focused alternative. |
The charting tools that actually matter in a live workflow
Most traders I’ve watched struggle with the same problem: they have too many tools open and too little clarity about what any of them are telling them. TradingView is genuinely excellent, but it’s also a platform where you can spend three hours customizing a chart and end up less confident about the trade than when you started.
The platforms that hold up in a live workflow are the ones that compress the decision. thinkorswim does that for options traders by putting the risk profile and the order ticket on the same screen. TrendSpider does it for systematic traders by replacing manual pattern recognition with a rule. Big Move Algo does it for traders who want a single, clear signal rather than a committee of indicators.
The uncomfortable truth about charting software is that more features rarely mean better trades. The traders who perform consistently tend to use fewer tools, not more. They pick a platform that fits their execution path, strip out everything that doesn’t directly inform a decision, and repeat the same process every session. The platform is infrastructure, not edge.
What actually creates edge is knowing what your signal means, having a tested execution path, and not second-guessing the setup once it appears. Any platform on this list can support that. The question is which one gets out of your way fast enough to let you act.
Big Move Algo: clear signals on TradingView, ready to trade
If you’ve spent time with TradingView and still find yourself hesitating at entries, Big Move Algo is worth a close look. It runs as a TradingView overlay, so you keep everything you already use, and adds one layer: a clear Long, Short, or Exit signal that tells you when conditions meet the strategy’s criteria.

The Fake Trend Detector filters out the choppy, low-conviction conditions where most retail traders give back gains. AUTO Mode means you can be up and running in minutes. MANUAL Mode gives experienced traders the ability to tune the parameters to their preferred markets and timeframes. Alerts fire across multiple platforms, and the indicator works on unlimited devices, so your phone and desktop stay in sync.
Try Big Move Algo and see how a signal-first approach changes the way you use your charts.
Sources and further reading
TradingView — Official platform page; the primary reference for community scripts, Pine Script documentation, and market coverage details.
StockCharts ACP — StockCharts’ Advanced Charting Platform page; useful for understanding overlay depth and web-based charting capabilities.
Wall Street Zen: 10 Best Stock Chart Apps — Roundup review that maps platform strengths to trader use cases; good for cross-referencing shortlist rationale.
IG Trading Charts Guide — Market analyst guidance on matching chart type and complexity to trader experience level.
Big Move Algo: First Trading Platform Checklist — Practical checklist for new traders evaluating their first platform; includes notes on signal overlays and TradingView setup.
Big Move Algo: Benefits of Automated Trade Signals — Explains how automated signal delivery integrates with live trading workflows.
Multi-Platform Trading Best Practices — Practical guidance on running multiple platforms and integrating charting, alerts, and execution for active traders.
Recommended
Comments