
Calculate Your True Edge in 5 Journal Moves: Win Rate vs Expectancy


Expectancy, the average profit or loss per trade, is the number that decides whether a strategy makes money over time. Win rate is only one input into that number, and it’s often the least important one. Pull your journal, calculate expectancy in dollars and in R, and judge your edge by that figure, not by how often you’re “right.”
TL;DR:
Win rate alone is misleading; focus on calculating your expectancy in dollars or R to determine actual profitability.
Expectancy depends on average wins and losses, with higher reward-to-risk ratios reducing the necessary win rate for profitability.
Sample size should exceed 30 trades per setup to reliably evaluate expectancy, with larger samples offering more trustworthy insights.
Lowering average loss and increasing average win are key levers to improve expectancy, not just aiming for a higher win rate.
Consistent trade entries, stops, and exits are essential for accurate expectancy tracking, which can be standardized using tools like Big Move Algo.
Table of Contents
Win Rate vs Expectancy: The Core Definitions
Win rate is simply winning trades divided by total trades. Trade 100 times and win 55, your win rate is 55%. Loss rate is just 1 minus win rate. Neither number tells you anything about size.
That’s where average win and average loss come in. Average win is the mean profit across all winning trades; average loss is the mean loss across losers, expressed as a positive (absolute) value so the math doesn’t get confusing.
Expectancy stitches these together:
Expectancy (dollars) = (Win rate × Average win) − (Loss rate × Average loss)
Expectancy ® = (Win rate × Average win in R) − (Loss rate × Average loss in R)
The expectancy formula is what determines whether a system is profitable over many trades, not the win rate sitting on top of it. R-normalized expectancy strips out account size and position sizing, so you can compare a $5,000 account’s swing setup against a $50,000 account’s day trade on equal footing.
The Math That Proves Win Rate Can Lie to You
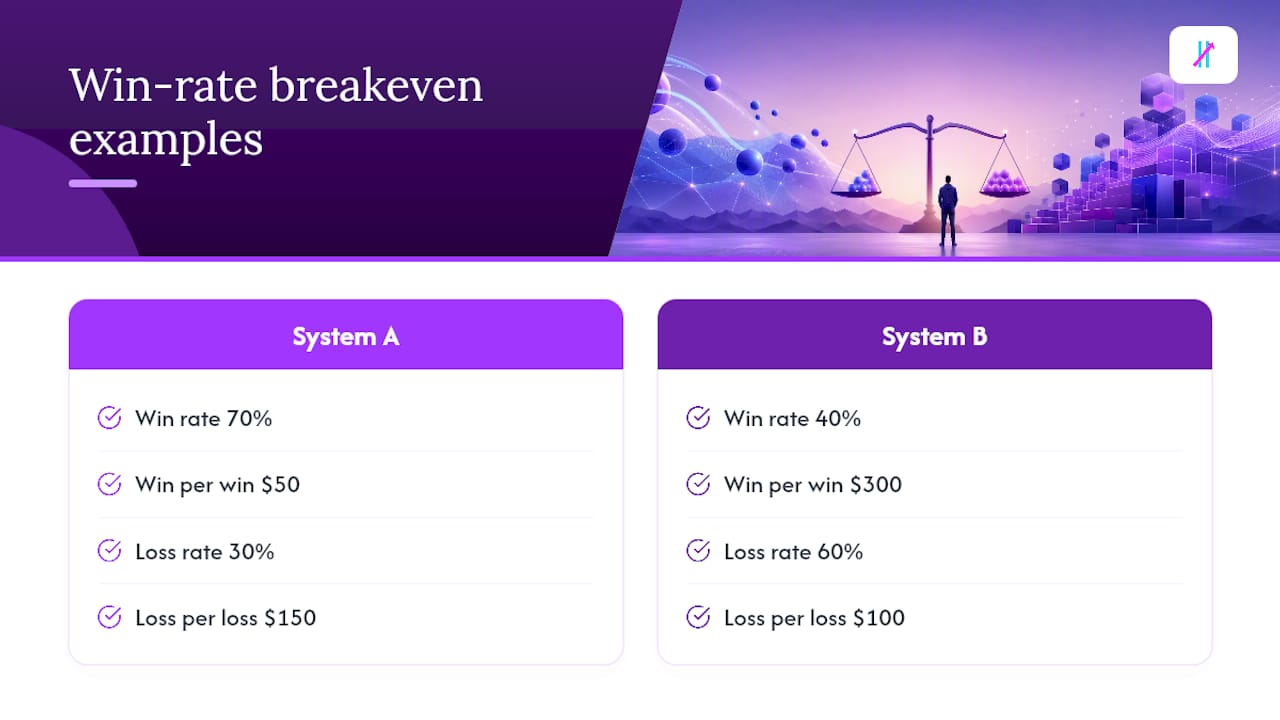
Here’s the classic trap. Expectancy = (0.70 × $50) − (0.30 × $150) = $35 − $45 = negative $10 per trade. Trade that system many times and you’re down overall, despite winning most of the time.
Now flip it. Expectancy = (0.40 × $300) − (0.60 × $100) = $120 − $60 = positive $60 per trade. The breakeven math behind this is simple: your required win rate drops as your reward-to-risk ratio climbs.
That relationship shows up clearly in a breakeven table:
A breakeven win-rate matrix like this is worth pinning above your desk. It tells you instantly whether your current win rate clears the bar your reward-to-risk ratio sets, or whether you’re fighting an uphill math problem every time you click “buy.”
Why a High Win Rate Feels Great and Means Little
Being right triggers a small dopamine hit, and that feeling is addictive. Traders chase win rate because it feels like validation, even when the payoff structure is quietly draining the account. That’s the core insight behind why win rate is emotionally satisfying but mathematically weak as a standalone number.
Reporting habits make it worse. Adjusting for realistic round-trip costs can turn an eye-catching stat into a mediocre one once you actually pay the spread.
Trader behavior compounds the problem in three common ways:
Cutting winners early to “lock in” a win, which shrinks average win.
Moving stops back to avoid taking a loss, which inflates average loss.
Counting a breakeven exit as a win to protect the win rate, which distorts both sides of the formula.
Pro Tip: When you evaluate someone else’s signal service or trading strategy, ask for average win and average loss, not just win rate. Without those two numbers, a headline win rate tells you almost nothing about whether the system actually makes money.
Calculating Expectancy From Your Own Trading Journal
You don’t need special software to find your real edge, just a clean export and a few formulas. A trading journal that logs P&L, entry and exit price, position size, and the R-multiple of each trade is the raw material.
Export every closed trade for a single setup, not your entire account blended together.
Calculate win rate: winning trades divided by total trades.
Calculate average win and average loss separately, using absolute values for losses.
Plug both into the expectancy formula, in dollars and in R.
Repeat by setup, since blending a breakout strategy with a mean-reversion strategy hides which one actually works.
Over 100 trades risking 1% of account equity each, that’s a rough theoretical gain near 26% before compounding effects and drawdown variance.
Sample size matters here. Treat anything under 30 trades as anecdote, 30 to 100 as a rough sketch, and 100 or more per setup as a data-backed sample worth acting on with confidence.
Practical Levers to Actually Improve Expectancy
Expectancy has exactly two moving parts you can influence directly: how much you lose when you’re wrong, and how much you gain when you’re right.
Lower your average loss. Honor your stop every time. Tighten it only where the setup logic supports it, and cut “hope” exits where you widen a stop because you don’t want to be wrong.
Raise your average win. Use a scale-out template on winners, trail a portion of the position, and resist the urge to take profit the moment a trade turns green.
Scale size only after confirming positive expectancy on at least 30 to 50 trades for that specific setup, using the same sample-size guidance as above.
Forward-test every change on a separate sample before rolling it into your live sizing, checking whether expectancy actually moved or whether variance just got lucky.
Pro Tip: Before widening a stop-loss “just this once,” calculate what that single decision does to your average loss over the next 50 trades. One bad habit repeated 50 times is what destroys expectancy, not one bad trade.
How Big Move Algo Supports Cleaner Expectancy Tracking
Expectancy calculations only work if your entries, stops, and exits are consistent. That’s the practical problem with hand-picked, discretionary entries: every trade has a slightly different R-definition, which makes your journal noisy and your expectancy math unreliable.
Big Move Algo’s TradingView indicator produces defined Long, Short, and Exit signals, which gives every trade the same structural starting point for R calculation. A few features matter specifically for this kind of tracking:
Fake Trend Detector filters out low-quality setups before they ever hit your journal, so your sample isn’t diluted with trades you shouldn’t have taken.
AUTO Mode applies a consistent signal logic with minimal setup, useful for traders who want a repeatable baseline before customizing.
Manual Mode lets more experienced traders adjust parameters while keeping the same signal framework across trades.
None of this replaces stop discipline or sound position sizing. Big Move Algo standardizes the entry and exit signal; expectancy still depends on how you manage the trade after that signal fires.
Misconceptions That Keep Traders Focused on the Wrong Number
The biggest misconception is treating win rate as a proxy for skill. It isn’t.
A second misconception: assuming expectancy is fixed once calculated. It shifts constantly with market regime, position sizing changes, and even small habit drift like moving stops. Recalculating expectancy only once a year, or worse, never, means you’re trading on outdated assumptions about your own edge.
Traders also confuse profit factor with expectancy. Profit factor (gross profit divided by gross loss) is a useful cross-check, but it can look healthy while expectancy per trade is thin if trade frequency is unusually high. Running both together, especially R-normalized expectancy alongside profit factor, catches cases where one metric flatters the other.
Finally, there’s the misconception that a negative expectancy strategy can be saved purely by increasing win rate. Sometimes it can, but often the cheaper fix is tightening the average loss side, since a single bad habit around stop discipline usually costs more than a few percentage points of missed win rate ever could.
Using Win Rate and Expectancy in Risk Management
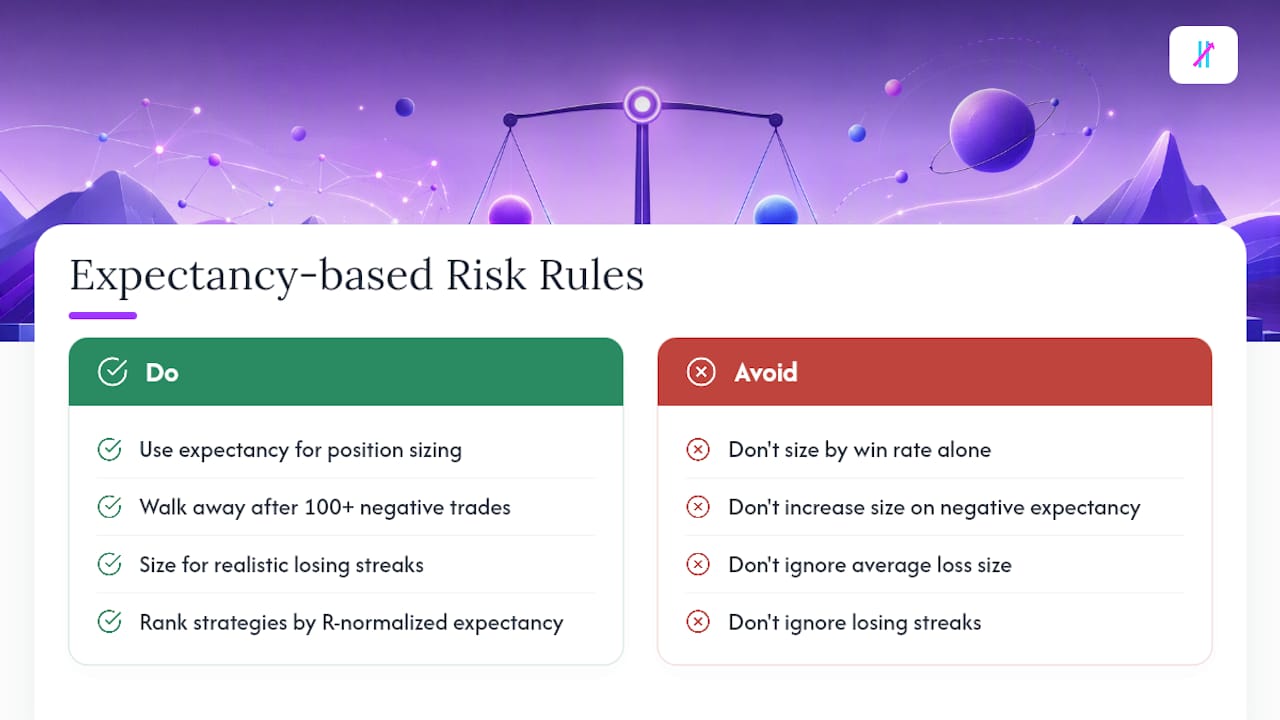
Risk management decisions should flow from expectancy, not from win rate alone. Position sizing is the clearest example: a strategy with a confirmed positive expectancy of 0.3R per trade over 150 trades can support a larger position size than a strategy showing 0.05R over just 40 trades, even if the second one has a flashier win rate.
Expectancy also tells you when to walk away from a setup. If a strategy has traded 100+ times with a consistently negative expectancy, no amount of “the next trade will turn it around” changes the math. That’s a signal to stop trading the setup, not to increase size hoping win rate improves.
Drawdown planning benefits from the same lens. Knowing your average loss size and your losing streak tendencies, both derivable from your expectancy calculation, lets you size positions so a realistic losing streak doesn’t wipe out the account.
Finally, expectancy helps you allocate risk across multiple strategies. If you trade three setups simultaneously, ranking them by R-normalized expectancy, not by which one “feels” like it’s winning more often, tells you where to concentrate size and where to trim exposure.
Expectancy in Practice Across Trading Styles
A scalper needs that elevated win rate just to clear breakeven, since tight profit targets leave little room for reward-to-risk to do the heavy lifting.
Swing traders and trend followers usually sit at the other end.
Crypto traders, dealing with higher volatility and wider stops, frequently see win rates in the 40% to 50% band, with expectancy driven heavily by how disciplined they are about letting the occasional large trend trade run.
The pattern holds across markets: style dictates the win rate you should expect, and reward-to-risk dictates whether that win rate is actually good enough. There’s no universal “good” win rate number, only a good win rate relative to your own reward-to-risk ratio.
Author Perspective: Make Expectancy Your Scoreboard
Check expectancy after every meaningful sample, not after every winning streak. Optimizing for win rate alone rewards the wrong behavior, cutting winners short and calling scratch trades wins. Track everything in R so a crypto setup and a forex setup can be compared honestly, on the same scale.
— Steven Hartwell
A Structured Way to Trade While You Track Expectancy
If you’re doing this math by hand and getting inconsistent entries every time you trade discretionarily, that inconsistency is exactly what makes expectancy hard to trust. Big Move Algo gives every trade the same defined Long, Short, and Exit signal, so your R-multiples are calculated from a consistent starting point instead of a different gut call each session.

The Fake Trend Detector screens out choppy, low-quality conditions before you ever log the trade, which keeps your sample cleaner for expectancy tracking across setups. AUTO Mode gets you running fast with minimal setup, while Manual Mode gives experienced traders room to fine-tune entries without losing that consistent signal structure. Plans run from the Version 2 subscription at $55 per month up through Version 3 Plus, with annual pricing available on the same page. If you want cleaner data feeding your next expectancy calculation, check the Big Move Algo plans and see which mode fits how you trade.
Sources
Formulas and examples draw on Pro Trading Journal, MetaTradingClub, and JournalX. For sizing math, see risk-reward ratio fundamentals.
FAQ
Is a 40% win rate good in trading?
A 40% win rate can be very profitable if your reward-to-risk ratio is 2:1 or higher, since the breakeven win rate at 2:1 is only 33.3%. Judge it against expectancy, not against the raw percentage alone.
Is a 60% win rate good for trading?
If average loss is much larger than average win, even 60% winners can produce negative expectancy.
Is a 30% win rate good?
It fails quickly on setups with tight profit targets close to a 1:1 payoff.
What is a good win rate percentage?
There’s no universal good win rate. What matters is whether your win rate clears the breakeven threshold set by your reward-to-risk ratio, since a 50% win rate at 1:1 breakeven and a 35% win rate at 3:1 can both be equally profitable.
How many trades do I need before trusting my expectancy number?
Treat fewer than 30 trades per setup as anecdote, 30 to 100 as a rough estimate, and 100 or more as a data-backed sample worth acting on. Always segment by individual setup rather than blending your whole account together.
Recommended
Comments