
One Indicator Clean Chart Trading: ATR Stops, Alerts and Big Move Algo
- Steven Hartwell

- 1 day ago
- 7 min read
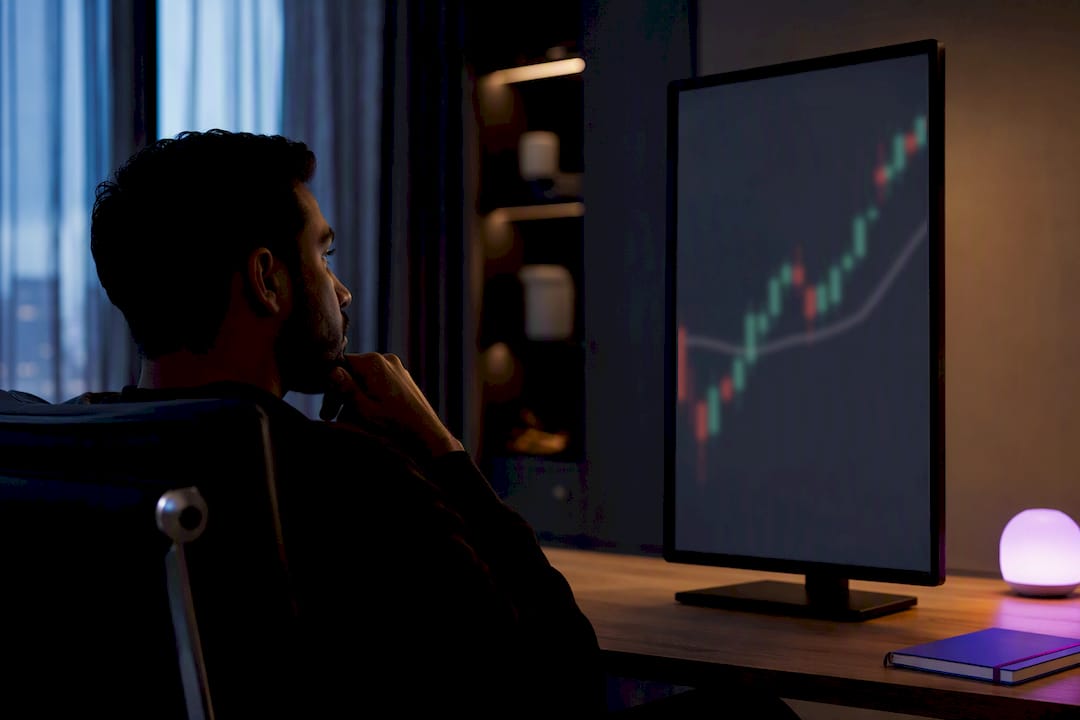
Clean chart trading means running one clarity-focused TradingView indicator that hands you Long, Short, and Exit signals instead of a screen buried under a dozen overlapping tools. The recommended first step is simple: pick a single rule-based signal generator, layer in a volatility filter and an ATR-based stop, and paper trade it before risking real money. Big Move Algo is one working example of this setup, built specifically around that structure.
TL;DR:
Using a single, rule-based TradingView indicator reduces clutter and emphasizes objective signals over multiple overlapping tools.
Setting default parameters such as a 10/20 moving average and ATR multiplier around 1.5 to 2.0 helps filter false signals effectively on higher timeframes.
Proper setup includes filters for volatility, trend direction, and optional RSI, along with alert configurations and thorough paper testing.
Trade rules should be explicit, requiring multiple conditions like indicator signals, trend confirmation, and filter thresholds before entering or exiting trades.
The system’s success depends on avoiding overfitting, trading in trending markets, and validating parameters on unseen data through backtesting.
Table of Contents
What Does Clean Chart Trading Actually Mean?
Clean chart trading is not the same as “naked charting,” where traders strip every indicator off and rely purely on price structure. It means the opposite kind of simplicity: one well-built TradingView indicator does the analytical heavy lifting, and everything else on your screen stays out of the way.
A single signal generator, like Big Move Algo, typically handles trend detection, entry timing, and exit logic in one script, so you’re not toggling between five separate tools trying to make them agree. It still pairs well with basic price-action context, like support zones or session highs, since the indicator tells you when, and structure tells you where.
This approach fits most naturally on:
Higher timeframes (1H and above) where signal noise is lower
Liquid markets like major forex pairs, large-cap crypto, and index futures
Traders who want repeatable rules over discretionary judgment calls
Why a Single Indicator Beats a Cluttered Chart
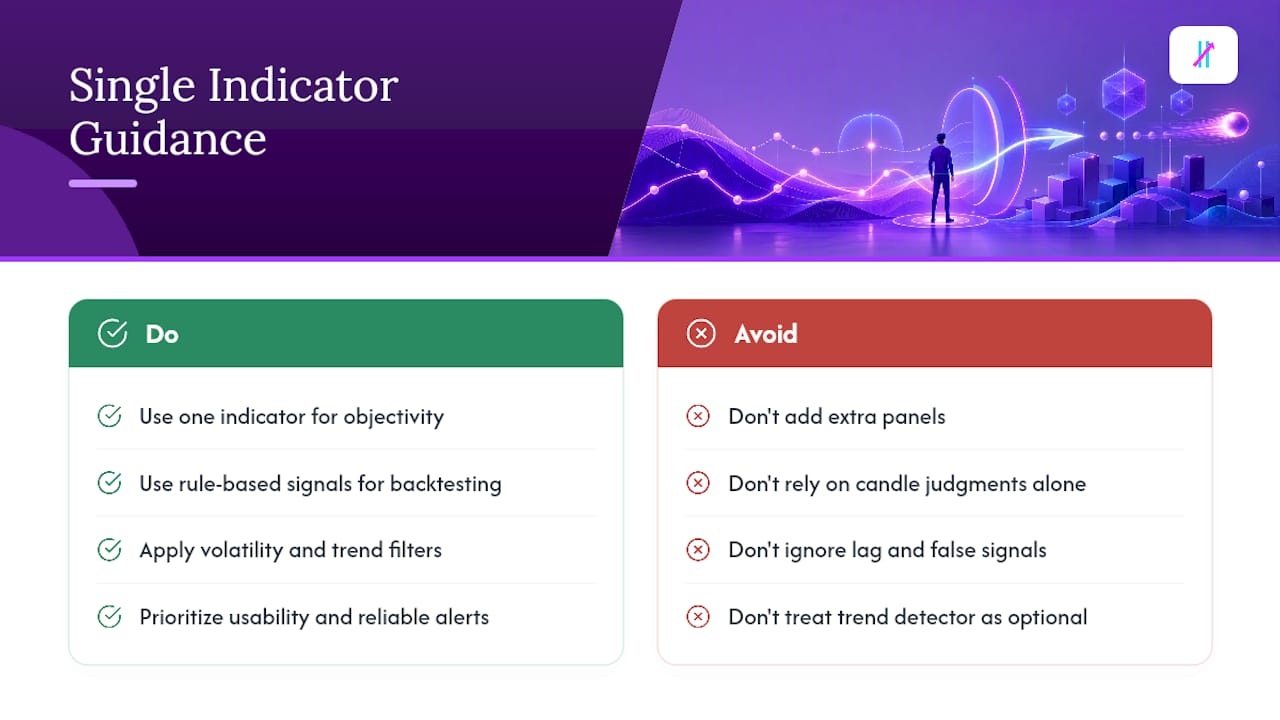
Objectivity is the real payoff. A defined signal either fires or it doesn’t, which removes the guessing game of “does this candle pattern count?” Rule-based systems are also far easier to backtest than pure price-action reading, because the logic is explicit rather than a judgment call, which is part of why indicator-based signals reduce interpretation compared with price action alone.
There’s a real tradeoff, though. Any indicator lags price to some degree, and no filter catches every false signal. That’s exactly why volatility and trend filters matter, and why a Fake Trend Detector style feature earns its place in a serious setup rather than being a nice extra.
None of this is a niche preference. Platform research on retail trader behavior found that usability and reliable alerting are major adoption drivers for chart-based tools, ahead of raw feature count. Traders don’t want more panels. They want fewer, better ones.
How to Set Up a Single-Indicator Trading Chart
Getting a clean chart trading setup running on TradingView takes less time than most people expect. Here’s the order that actually works:
Add the indicator to your chart. Search it in TradingView’s indicator library, apply it, and clear off any other overlays you’ve accumulated. This is also the moment to customize your chart signals for readability, color contrast, and label size.
Choose your timeframe. Start on the 1H or 4H chart for swing-style trading, or 15M if you’re actively watching intraday moves. Avoid anything under 5M until you’ve tested the signal’s behavior on a slower chart first.
Set default parameters. A reasonable starting point mirrors what’s common in TradingView community scripts: a moving average length around 10/20 for trend direction, and an ATR multiplier near 1.5 to 2.0 for the volatility gate, an approach seen in community buy/sell scripts that combine moving averages with ATR filters.
Enable your filters. Turn on the ATR volatility threshold so the system ignores low-range, choppy bars. Turn on the trend moving average so signals only fire with the broader direction. An optional RSI filter can trim a few more false entries if your market tends to whipsaw.
Pick AUTO or Manual mode. AUTO mode works well if you want the indicator’s built-in logic to handle filter decisions for you. Manual mode makes sense once you understand how each filter changes signal frequency and want to fine-tune it yourself.
Set up alerts before you start watching the chart. Configure alerts tied to Long, Short, and Exit conditions so you’re not manually staring at candles all day.
Run a testing checklist. Confirm the indicator fires on obvious historical trend moves, check that filters actually suppress signals during flat periods, and paper trade for at least two weeks before going live.
Pro Tip: Change one parameter at a time when you’re testing. Adjusting the ATR multiplier and the moving average length in the same session makes it impossible to know which change actually improved your results.
Signal Rules and Trade Management You Can Actually Follow
A clean chart trading system only works if your rules are specific enough to remove judgment calls. Vague rules produce the same hesitation and second-guessing you were trying to escape in the first place.
A workable Long rule looks like this: indicator prints a Long signal, the trend filter confirms upward direction, and the ATR volatility filter is above its threshold (meaning the market isn’t dead flat). All three conditions, not just the signal alone.
A workable Short rule mirrors it in the opposite direction, and your Exit rule should trigger on either the indicator’s Exit signal or a stop-loss hit, whichever comes first.
For stop placement, ATR-based stops adjust dynamically to current volatility, avoiding fixed stop levels that may be inappropriate in different market conditions. A common approach: place your stop at a multiple of the current ATR value from entry, commonly between one and two times entry ATR.
Position sizing follows from that stop distance. Risk per trade (say, 1% of account equity) divided by your stop distance in price terms tells you how many units or contracts to trade.
Track these in a trade journal:
Win rate and average risk-to-reward ratio
Signal-to-fill slippage
Number of filtered-out signals versus taken trades
Maximum drawdown over rolling 20-trade windows
Data point worth remembering: platforms with strong backtesting and alerting tools consistently rank higher with traders precisely because those features let a single-indicator system move from idea to repeatable execution, rather than staying a one-off experiment.
Common Pitfalls That Wreck a Clean Chart Setup
The most common mistake is drift. A trader starts with one indicator, then adds a second “just to confirm,” then a third. Within a month the chart looks exactly like the cluttered mess they were trying to escape, and adding multiple confirmation indicators can slow decision-making rather than improve it. Fix it by picking one confirmation tool, at most, and giving it a fair test window before touching anything else.
Sideways, low-volatility markets are the second trap. Signals fire, but they chop you up with small losses. Either stand aside entirely when your ATR filter flags a low-range period, or tighten your filter thresholds until conditions genuinely favor trending moves.
Overfitting parameters to past price action is the quiet killer. A setting that looks perfect on last year’s chart often falls apart going forward. Test on out-of-sample data you haven’t already optimized against, and size your first live trades small regardless of how good the backtest looked.
Stack no more than one confirmation indicator alongside your primary signal
Stand aside or tighten filters during flat, low-ATR conditions
Validate parameters on unseen data before trusting a backtest
Pro Tip: Increase position size in small steps, maybe 10 to 20 percent every few weeks of consistent results, rather than jumping straight to full size the moment a strategy looks promising.
Backtesting and Automating Signals on TradingView
Turning a rule-based signal into a repeatable habit means using TradingView’s own testing tools, not just eyeballing the chart.
Run the strategy tester or replay mode to sample how your signal performed across different historical stretches, including choppy periods and strong trends, exactly the kind of historical validation Pine Script’s strategy tester is built for.
Build alerts for each signal type. Set separate alerts for Long, Short, and Exit conditions, and route them to mobile push notifications or a webhook if you’re feeding an execution system, following the same alert setup process TradingView documents for buy/sell scripts.
Follow a staged rollout. Backtest first, paper trade next for a meaningful sample size, then move to small live size, and only scale up once the edge holds outside your original test window, a sequence that mirrors the safe implementation path recommended for rule-based systems.
For traders who want a broader view of indicator categories before finalizing filter choices, a primer on trend, momentum, and volume indicators is worth a skim.
Why We Built Big Move Algo Around Clarity First
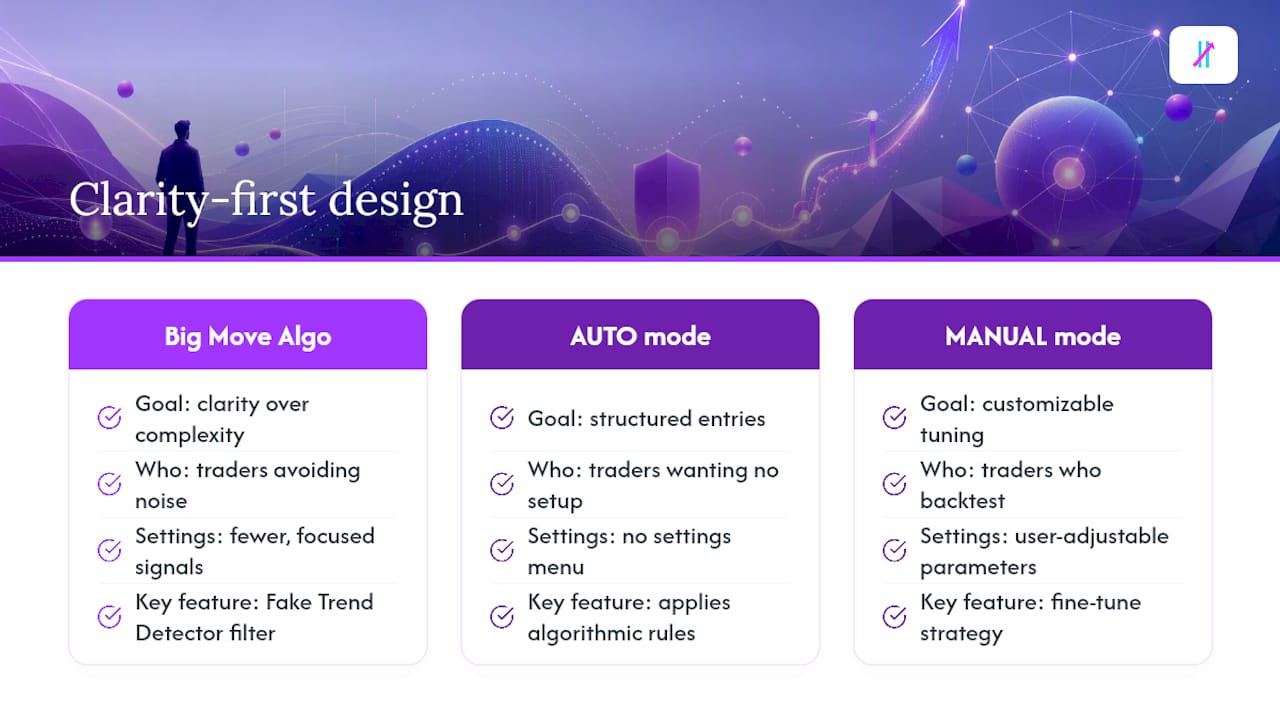
I’ve watched traders drown their own good instincts under six indicators that all disagree with each other. Big Move Algo exists because clarity, not complexity, is what actually helps people hold a trade through normal noise. That’s why the Fake Trend Detector matters so much: it’s a filter designed specifically to keep you out of the choppy, low-conviction stretches where most single-indicator systems bleed small losses.
AUTO mode exists for traders who want structure without a settings menu. Manual mode exists for the ones who’ve done the backtesting homework and want to tune it. Either way, the goal was never more data. It was fewer, better decisions.
— Steven Hartwell
Try Big Move Algo: Quick Installation and First Steps
If you’ve read this far, you already understand the mechanics: one indicator, clear filters, ATR-based risk control. Big Move Algo is built as a working version of exactly that system, not a stripped-down demo. A subscription gets you full indicator access, both AUTO and Manual modes, and the Fake Trend Detector filtering out the low-quality setups that eat most traders’ accounts.

Access is instant after payment through Stripe, and it works the same way across crypto, forex, stocks, indices, and commodities charts. Before you size up, do exactly what this guide recommends: run it through TradingView’s strategy tester on your usual markets, paper trade the signals for a couple of weeks, and confirm the rules fit your risk tolerance. When you’re ready, the quick installation guide walks you through getting the indicator live on your chart in a few minutes.
Sources
For deeper technical setup, see TradingView’s own Pine Script guide for scripting and alert conditions, and the buy/sell signal overview for active traders for a broader look at confirmation filters.
Recommended
Comments