
Commodities Trend Trading: A Practical Starter System
- Steven Hartwell

- Aug 21
- 13 min read
Commodities trend trading means entering a position when momentum is confirmed and holding it until the system itself signals a reversal, not when your gut does. Its core benefit is diversification: trend strategies often move independently of stocks and bonds, and they’ve historically outperformed static commodity baskets during inflation spikes by rotating into whatever is actually moving.
Your immediate next step: pick one commodity market, write down a single entry and exit rule, and backtest it on at least two years of data before risking a dollar.
Win rate reality: most trend systems win fewer than 4 out of 10 trades.
Holding horizon: weeks to months, not minutes or days.
Top-line risk rule: never risk more than 1% to 2% of account equity on a single trade.
Quick fact: Commodity trend following tends to lose money on most individual days and makes its money back on a handful of outsized winning trades.
Key Takeaways
Commodities trend trading works because a small number of large winning trades cover many small losses, and disciplined position sizing determines whether a trader survives long enough to capture those winners.
Point | Details |
Expect a low win rate | Most trend systems win under 40% of trades; the payoff skew is what makes them profitable. |
Size positions by volatility | Adjust contract count as market volatility changes to keep dollar risk constant per trade. |
Diversify across sectors | Trading energy, metals, and agriculture together increases the odds one market is trending. |
Backtest with real costs | Include slippage, commissions, and roll costs before trusting any backtest result. |
Automate execution, not judgment | Tools like Big Move Algo can deliver signals, but the underlying rules still need testing first. |
Table of Contents
What Is Trend Trading in Commodities Markets?
Trend following means buying strength and selling weakness, then riding the position until the trend itself breaks. It’s the opposite of mean reversion, which bets that price snaps back toward an average after moving too far, too fast. In commodities, trend following works with the grain of the market’s structural tendency to run: a drought that cuts grain supply doesn’t resolve in a day, and neither does a shipping bottleneck that squeezes crude oil.
Mean reversion tends to work better in range-bound, low-volatility conditions, like grain markets between planting and harvest news. Trend following tends to work better once a catalyst, like a supply shock or a demand surge, kicks a market out of its range and keeps it moving for weeks.
Here’s the trade-off you need to accept before you start:
Win rates on classic trend systems usually sit under forty percent.
The payoff distribution is skewed: many small losses, offset by a few large wins that carry the whole system.
Average winning trades need to be meaningfully larger than average losing trades, or the math doesn’t work at all.
Quick fact: A trend system that wins 35% of the time can still be highly profitable if average winners are three times the size of average losers. That ratio, not the win rate, is what actually matters.
Why Do Commodity Markets Trend So Reliably?
Commodities trend for structural reasons that don’t apply the same way to equities. Supply is often fixed in the short run. A refinery outage, a frost in coffee country, or a mine strike can’t be fixed by printing more units, so prices have to do the adjusting instead.
The main drivers behind commodity trends include:
Supply shocks — weather events, geopolitical disruptions, mine or well outages.
Inventory cycles — stockpile drawdowns and builds reported weekly or monthly by agencies.
Seasonality — planting and harvest cycles in agriculture, heating and driving season in energy.
Geopolitical shocks — export bans, sanctions, and trade disputes.
Demand shifts — industrial cycles, emerging-market consumption growth.
Low participation — thinner markets like certain grains or softs can trend harder once momentum builds, since there’s less liquidity to absorb the move.
Academic research backs this up directly. AQR’s work on time-series momentum found positive returns across decades and dozens of markets, commodities included, and recommended combining multiple look-back horizons with volatility scaling rather than betting on one signal alone.
Diversifying across uncorrelated sectors matters because any single commodity can grind sideways for months. Spreading exposure across energy, metals, and agriculture increases the odds that at least one sector is trending at any given time.
That’s the practical case for trading a basket rather than one favorite market: dry spells in oil don’t necessarily mean dry spells in copper or soybeans.
Which Trend-Following Systems Should You Test First?
Three system families cover most of what retail trend traders actually use. Each has a different personality, and testing all three on the same market will teach you more than reading ten articles about them.
Donchian breakout (20/10). Buy when price closes above the 20-day high, exit when it closes below the 10-day low. Simple, reactive, and one of the oldest documented commodity systems.
Moving average crossover (50/200). Go long when the 50-day average crosses above the 200-day average, exit on the reverse cross. Slower, smoother, and less prone to whipsaw than breakouts, but it enters trends later.
Time-series momentum (1/3/12-month blend). Score a market as bullish if its return over the past 1, 3, and 12 months is positive, then size the position by volatility. This is the approach AQR’s research validated across long historical samples.
Each comes with trade-offs. The Donchian breakout catches trends early but generates more false starts in choppy markets. The moving average crossover is more stable and easier to trust, but the lag means you give back a chunk of the move before you’re even in the trade. Time-series momentum smooths out noise by blending horizons, but it’s harder to backtest by hand and usually needs a spreadsheet or a coded script.
Here’s a mini walkthrough using the Donchian approach on a hypothetical crude oil setup. Price breaks above the 20-day high at $82. You enter long and set an initial stop at the 10-day low, say $78, a $4 risk per barrel. As the trade moves in your favor, you trail the stop up to each new 10-day low instead of leaving it fixed. If oil runs to $95 and then closes below the rising 10-day low at $91, you’re out with a $9 gain against a $4 risk, a healthy 2.25 reward-to-risk ratio on that one trade.

Pro Tip: Test each system on at least three different commodities before you trust the results. A rule that looks brilliant on gold and terrible on natural gas is telling you something about the rule’s stability, not about gold or gas.
What Indicators Confirm a Real Commodity Trend?
Price action drives the trade, but a few indicators reduce the odds you’re stepping into a fakeout. Investopedia’s rundown of the four most common trend indicators covers the tools most retail traders lean on:
Moving averages smooth out daily noise and define the trend’s direction and slope.
MACD measures momentum by comparing two moving averages, and a bullish cross above the signal line often confirms a breakout has real thrust behind it.
RSI flags overbought or oversold conditions; in a strong trend, RSI can stay “overbought” for weeks, so use it for context, not automatic exits.
On-Balance Volume (OBV) tracks volume flow, and a rising OBV alongside rising price confirms buyers are actually behind the move, not just a thin, low-volume drift.
ATR (Average True Range) doesn’t confirm direction, but it tells you how much room a market needs for its stop, which matters more than most beginners realize.
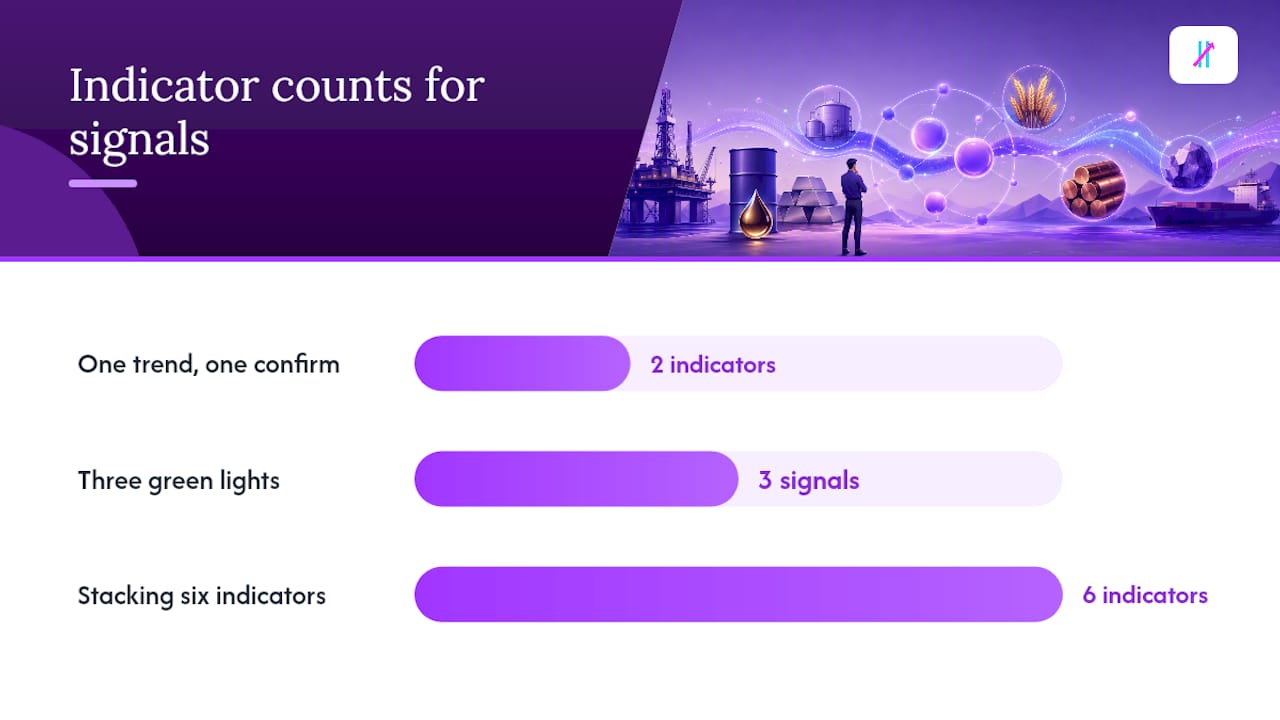
A workable confirmation checklist looks like this: price breaks a defined level, one momentum indicator (MACD or RSI) agrees with the direction, and volume or OBV isn’t contradicting the move. Three green lights, not five.
Pro Tip: Stacking six indicators on one chart doesn’t make a signal more reliable, it usually just means you’ve curve-fit a system to look good on your specific backtest. Pick one trend indicator and one confirmation indicator, and leave it there.
How Should You Size Positions and Manage Risk?
Risk architecture is what separates traders who survive ten years of trend trading from those who blow up in six months. The system’s entry rule barely matters compared to how much you risk per trade.
Here’s a numeric example using a $50,000 account:
Set risk per trade: 1% of equity, or $500.
Identify distance to stop: if your Donchian stop sits $2 below entry on a commodity where each contract point is worth $50, that’s $100 of risk per contract at $2 of adverse movement ($2 x $50).
Calculate position size: $500 risk divided by $100 risk per contract equals 5 contracts.
Adjust for volatility: if that market’s average daily range doubles, cut the position size in half to keep dollar risk constant.
That fourth step, volatility scaling, is the detail most beginners skip and the one long-run historical research on trend following treats as essential to keeping any single market from dominating your portfolio’s risk.
A basic risk checklist to run before you place a trade:
Maximum acceptable drawdown defined in advance (many trend traders plan for 20% to 30% peak-to-trough).
Portfolio-level volatility target set and monitored, not just per-trade risk.
Correlation weighting across markets, since being long crude, heating oil, and gasoline simultaneously is really one energy bet, not three.
A hard rule for how many uncorrelated positions you’ll hold at once, so no single sector controls your account.
Slippage and roll costs are the quiet account killers. Futures contracts expire and need to be rolled to the next month, which costs money in contango markets, and market orders during volatile breaks fill worse than your backtest assumes. Institutional research on optimal market mix and diversification points out that traders who ignore these frictions in testing consistently overstate their real-world returns.
Pro Tip: When backtesting, add a flat 0.1% to 0.2% cost assumption per trade for slippage and commissions combined. If your strategy’s edge disappears once you add that friction, the edge probably was never real.
How Can You Trade Commodity Trends With a Small Account?
You don’t need six figures to trade commodity trends, but your instrument choice matters more than it does for a large account. Micro futures contracts are typically a tenth the size of standard contracts and often carry margin requirements under $1,000, which makes proper position sizing possible even with $5,000 to $10,000.
Micro futures: low capital requirement, direct market exposure, but you still need to manage rollovers.
Commodity CFDs: flexible sizing, but check your broker’s regulatory standing and cost structure carefully.
Broad commodity ETFs: simple to buy and hold, but many track futures indexes and suffer from contango drag over time.
Demo or paper trading: zero capital risk, the right place to prove a system before it touches real money.
Account Size | Reasonable Approach | Sizing Heuristic |
$5,000 to $10,000 | Micro futures, one to two markets | Risk 1% per trade, one position at a time |
$15,000 or more | Micro futures or small futures, three to five markets | Risk 1% per trade, volatility-scaled across markets |
Demo account | Any instrument | Run full-size rules to test psychology, not just returns |
ETFs and futures behave differently even when they track the same commodity. Futures have expiration and roll costs baked in; ETFs bundle those costs into the fund’s structure, and tracking error can quietly erode returns over a multi-month trend. Confirm your broker’s margin schedule and micro-contract availability directly through resources like the National Futures Association before committing capital.
How Do You Stay Disciplined Through Losing Streaks?
A run of seven or eight consecutive losing trades isn’t a broken system, it’s a normal week in trend trading’s history. What separates traders who survive that stretch from those who quit isn’t talent, it’s position sizing small enough that eight losses in a row costs single digits of account equity, not half of it.
Keep a trade journal that logs the rule followed, not just the outcome.
Automate exits where possible so a bad night’s sleep doesn’t override your stop.
Set a pre-defined pause trigger, like three months of underperformance versus your backtest, to review rather than abandon the system mid-drawdown.
Performance varies by sector and timeframe too. Energy trends can move violently over weeks; agricultural trends often unfold over full growing seasons.
Pro Tip: Write your maximum acceptable losing streak on a sticky note before you start trading live. When you hit it, you’ll already know whether to pause or push through, instead of deciding in the moment when you’re most likely to get it wrong.
What’s a Simple Plan to Start Trading Commodity Trends?
Getting from idea to live trade works best as a sequence, not a jump.
Define one rule set. Pick a single entry and exit combination, like the Donchian 20/10 breakout, and write it down in full.
Collect clean historical data. Use a platform with reliable futures or ETF price history going back at least ten years if possible.
Backtest with real friction included. Add slippage, commissions, and roll costs; test out-of-sample on data the rule wasn’t built on.
Run it on demo for a fixed period. Commit to a set number of months or trades, not “until it feels right.”
Refine sizing and rules based on demo results. Adjust position sizing formulas, not the entry logic itself, unless the logic is clearly broken.
Move to a small live position with strict risk control. Start at half your intended size for the first month.
Backtest musts worth repeating: realistic transaction costs, roll costs modeled explicitly for futures, and enough history to include at least one full commodity cycle, not just a bull run.
Before moving from demo to live, check for:
Performance that’s stable across different date ranges, not just one lucky stretch.
Drawdowns you can stomach financially and psychologically, based on the demo run.
Operational readiness, meaning your broker, margin account, and order types are all confirmed and tested.
Checking scheduled data releases matters here too. USDA crop reports and EIA energy inventory data routinely trigger the exact volatility spikes that either validate or wreck a fresh trend position, so build those dates into your trade calendar from day one.
Which Tools Belong in a Commodity Trend Workflow?
A workable toolkit needs four things: reliable historical data, the ability to code or configure breakout and momentum rules, cost modeling for commissions and slippage, and some form of automated alerting so you’re not staring at charts all day.
Charting platforms with backtesting modules that let you test multiple horizons at once.
Data feeds that include enough history to cover at least one full commodity cycle.
Alert or automation systems that fire the moment your rule triggers, not five minutes after you happened to check.
A journal or spreadsheet to track every trade against the rule that generated it.
This is where a TradingView indicator like Big Move Algo fits naturally into a trend-trading workflow. It generates Long, Short, and Exit signals directly on the chart, so instead of manually checking moving average crosses or Donchian levels every session, you get the signal delivered as an alert. AUTO Mode works well if you want a low-setup starting point while you’re still learning how the rules behave; Manual Mode gives more experienced traders room to tune sensitivity once they understand their own risk tolerance. The built-in Fake Trend Detector is worth noting specifically for commodities, since thin, low-participation markets are exactly where false breakouts happen most often, and filtering those out before you’re in a bad trade is more valuable than any single entry signal.
Pro Tip: Automation removes emotional flinching, it doesn’t remove model risk. A rule fed into an alert system is still just a rule, and every rule needs backtesting before it gets a single dollar behind it.
Big Move Algo works across commodities, crypto, forex, stocks, and indices, supports unlimited devices, and delivers alerts wherever you actually watch your charts. If you’re building out a systematic approach, pairing a signal-based framework with the risk rules covered above is a far more reliable path than watching charts and hoping you catch the breakout in real time. A monthly or annual subscription gets you instant access, with free updates included as the indicator evolves.
Which Beliefs About Trend Trading Are Overrated?
Most retail traders overrate the entry rule and underrate position sizing, and that ordering is backward. A mediocre entry rule with disciplined sizing survives; a brilliant entry rule with sloppy sizing eventually blows up an account. The research on time-series momentum makes this obvious once you actually read it: the volatility scaling matters as much as the signal itself, yet almost every retail trading forum spends 90% of its energy debating which moving average length is “best.”
The conventional advice to “just find a winning strategy” also skips the harder truth: most viable systems look boring in isolation and only earn their keep through diversification across uncorrelated commodity sectors. A trader running one market is gambling on that market’s cycle. A trader running five uncorrelated markets with equal risk weighting is running an actual business.
If there’s one thing beginners should prioritize first, it’s building the discipline to survive a losing streak with a system, before worrying about optimizing that system further. Automation and clean signal tools help here, but they’re a support structure, not a substitute for understanding why the losses happen in the first place.
Where Can You Learn More About Trend Trading?
AQR’s time-series momentum research for the academic backbone behind multi-horizon momentum systems.
Man Group’s market mix analysis for how diversification trades off crisis performance against long-run Sharpe.
Investopedia’s indicator guide for a practical breakdown of MACD, RSI, and OBV.
FXEmpire’s commodity trend guide for real-world implementation notes on small-account trading.
Graham Capital’s trend following primer for how trend strategies behave as portfolio diversifiers during inflation spikes.
Common Questions About Commodities Trend Trading
Is commodities trend trading profitable for beginners? It can be, but only with strict risk control. Win rates typically run below 40%, so profitability depends on letting winning trades run far longer than losing ones, not on picking correctly most of the time.
What’s the best commodity to start trend trading with? There’s no single best market. Liquid, well-established markets like crude oil, gold, or corn tend to have cleaner data and tighter spreads, which makes them easier to backtest and learn on before expanding into thinner markets.
How much money do I need to start trading commodity trends? Micro futures contracts have made it possible to start with as little as a few thousand dollars, though most traders are more comfortable starting with $5,000 to $10,000 to allow for proper position sizing across even one or two markets.
How long should I demo trade before going live? There’s no universal number, but running a system through at least 20 to 30 signals or several months, whichever comes first, gives you a more honest read than a handful of lucky trades.
Can automation replace manual analysis in trend trading? Automation removes emotional interference and speeds up execution, but it doesn’t replace the need for a backtested rule set. A tool like Big Move Algo can generate and deliver signals, but the underlying strategy still has to be validated before it’s trusted with real capital.
Sources
Recommended
Comments