
0–5 Scorecard: Trade False Breakouts in 60 Seconds

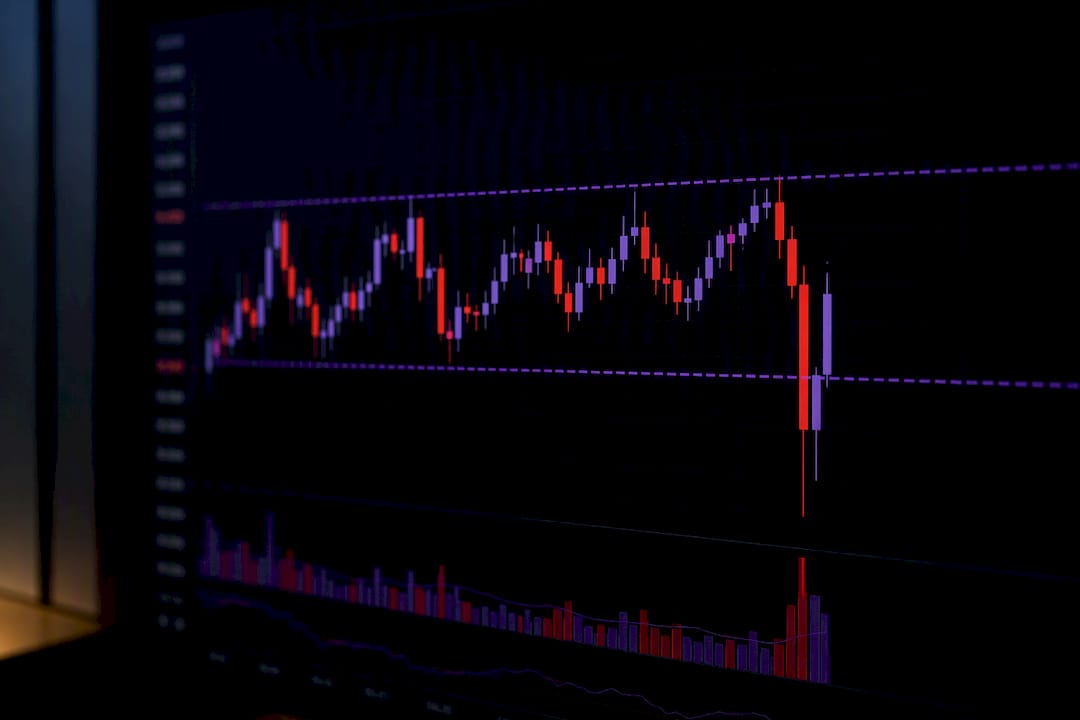
A false breakout, or fakeout, happens when price pokes past a support or resistance level and then snaps back inside the range, trapping everyone who bought or sold the break. The tactical fix is simple: never trade the poke itself. Run a quick score on volume, close location, and distance beyond the level. High score, take the break live. Low score, wait for a retest or fade it against the crowd.
TL;DR:
Breakouts on lower timeframes (1 to 15 minutes) have higher failure rates and require stricter volume and move confirmations before trading.
A breakout becomes more reliable with a close beyond the level on higher timeframes, especially when supported by volume at least 1.5 to 2 times the average.
Using a five-point scorecard shortly after a breakout bar closes helps determine whether to trade, fade, or wait for a retest, based on volume, close location, ATR distance, session, and trend confluence.
During high-liquidity periods like London or New York sessions, false breakouts are less common, whereas thin-market conditions or major news releases increase fakeout risks.
Managing risk with ATR-based stops and smaller position sizes on fade attempts enhances protection against false signals and avoids chasing losses.
Table of Contents
What a False Breakout Looks Like
Most fakeouts start the same way. Price approaches an obvious level, usually one with a cluster of stop orders sitting just beyond it, and a sharp move pierces that line. Retail traders piling in on the break become the exit liquidity for whoever engineered the sweep. Investopedia describes this as a breakout that fails because the initial breach draws in orders that get absorbed rather than followed by real continuation.
The tell is usually in the candle itself, not the headline move. A wick that pokes through a level and snaps back means the market rejected that price. A close beyond the level, especially on the higher timeframe you’re trading, carries far more weight. Bar close location is the single most useful piece of information you get for free.
There’s a real trade-off buried in timeframe choice:
Lower timeframe charts (1 minute to 15 minute) throw off far more breakout signals, and a much larger share of them fail.
Breaks on daily and higher timeframes tend to fail less often, but failures on these timeframes can result in larger losses due to wider stop distances.
That’s the core tension in any false breakout indicator setup: trade more often on a small timeframe and eat more losers, or trade less often on a bigger timeframe and eat bigger ones when you’re wrong.
The 0–5 Breakout Scorecard: Your First 60 Seconds
The moment a breakout bar closes, you don’t need an opinion. You need a score. Run these five checks in order, give one point for each that passes, and let the total tell you what to do.
Volume check. Compare the breakout bar’s volume to the 20-period average. A move on light volume below roughly 1.5 to 2 times that average is a weak signal and often reverses.
Close location. Did the bar close beyond the level, or just wick through it? A close that holds beyond the line scores a point; a long wick with a close back inside does not.
ATR distance. Measure how far the close sits beyond the level using the 14-period Average True Range. A close of at least 0.5x ATR past the line filters out noise; anything tighter is statistically closer to a coin flip.
Session and liquidity check. Is this happening during a thin session, or during the London/New York overlap when depth is real? Thin markets manufacture fakeouts because a small order can move price disproportionately.
Context and confluence. Does the break align with a higher timeframe trend, or is it fighting one? A three-point checklist that folds in structure alongside volume and close catches most of the traps a single indicator would miss.
Add up the score. A 4 or 5 means the break has enough behind it to trade live. A 2 or 3 means you wait for a retest before committing capital. A 0 or 1 is a strong candidate to fade against the initial move.
Statistic to remember: breakout bars printing under roughly 1.5 to 2 times average volume carry a materially higher chance of reversing, which is why volume gets checked first, not last.
Pro Tip: Write your score on the chart in real time, before you form an opinion on direction. Scoring first and deciding second keeps your bias from grading its own homework.
Fade the Failure or Trade the Retest?
Once you’ve scored a break and decided it’s suspect, you have two real options: fade it immediately or wait for the market to retest the level before entering.
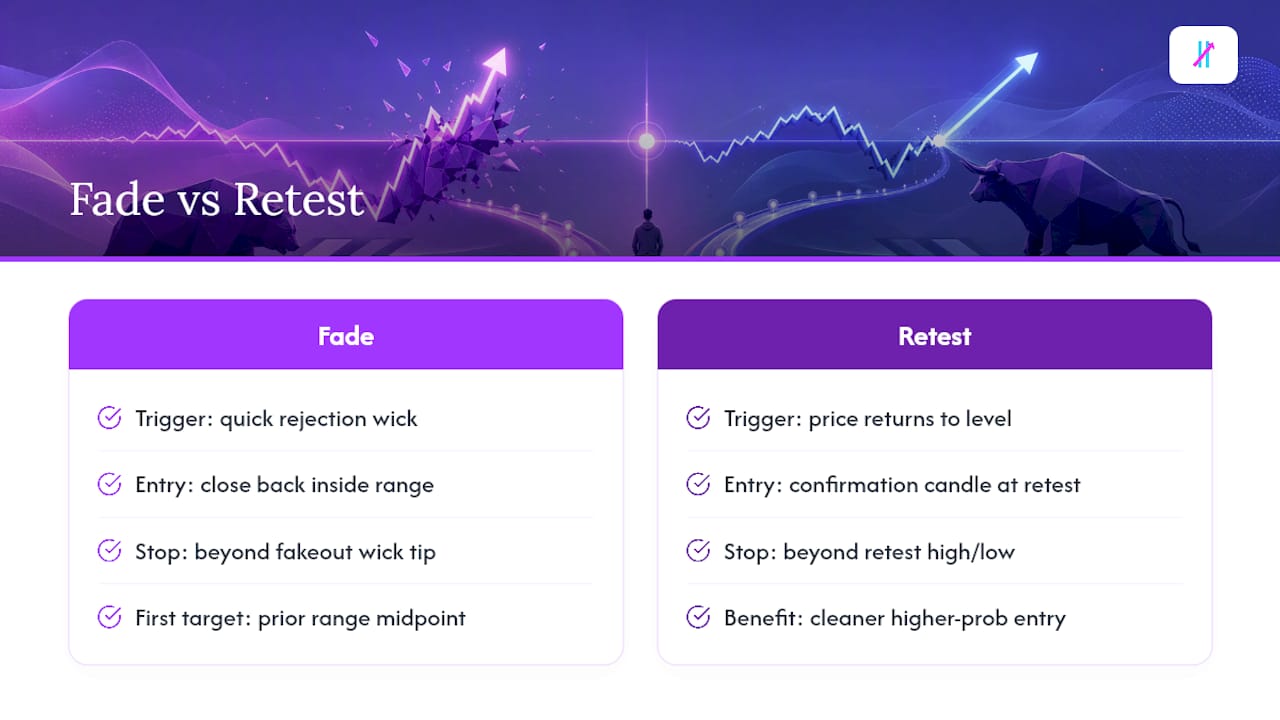
Fading works when the rejection is obvious and fast. The trigger is a close back inside the range on a reversal candle, ideally one with a long wick showing where the trapped buyers or sellers gave up. Stop placement goes just beyond the fakeout’s extreme, the wick tip, not the body. A realistic first target sits at the midpoint of the prior range, since fades tend to move fast but not always far. Fading rewards traders who wait for genuinely strong rejection rather than guessing the top or bottom of the move.
Retest entries ask for more patience but tend to pay off with better odds. You wait for the failed break, the reversal, and then a return to test the level from the other side. Entry comes on a confirmation candle at that retest, not before. Stop placement sits just beyond the retest’s high or low. Waiting for the retest gives up some of the move in exchange for a cleaner, higher-probability entry, which is why many traders treat it as their default setup rather than the exception.
Neither approach works well in a strongly trending market. When price is grinding one direction with conviction, a breakout that looks fake can simply be a pause before continuation, and fading it turns into fighting a freight train. If the higher timeframe trend is steep, sit out or wait for a much cleaner setup.
Timeframe, Session, and Instrument Considerations
The same checklist needs different thresholds depending on where and what you’re trading.
On a 1 minute or 5 minute chart, expect a high failure rate. Tighten your volume threshold and treat every break with suspicion until it clears a retest.
On daily or 4 hour charts, false breaks happen less often, but a wrong one costs more since stops sit further from entry. Higher timeframe breaks fail less frequently, which is exactly why swing traders lean on them.
The London and New York session overlap carries the deepest liquidity of the trading day, which makes breaks during that window more trustworthy. Breaks during the Asia-only session, or right around major newsprints like NFP or FOMC, cluster in low-liquidity windows and deserve extra skepticism.
Futures and major forex pairs carry enough depth that your volume threshold works as designed. Micro-cap stocks and thinner crypto pairs need a wider buffer, since a single large order can fake a breakout that would never fool a deeper market.
Data point worth internalizing: avoiding the first few minutes after a tier-one economic release isn’t paranoia, it’s just respecting that volatility spikes around news manufacture breaks that have nothing to do with structure.
Risk Management and Sizing for False Break Setups
None of the scoring or entry logic matters if your risk rules are loose. Stops belong at a distance dictated by ATR, not by round numbers, because round numbers are exactly where clustered stop orders live and get hunted.
Size fade trades smaller than retest trades. Fades move fast against a still-uncertain read on the market, so risking 0.25% of account equity per fade versus up to 0.5% to 1% on a confirmed retest setup is a reasonable split many traders use.
Set a daily loss limit of a small percentage of equity and stop trading once you hit it. Fakeout trading punishes traders who chase losses with bigger size.
Take partial profits at your first target and trail the remainder rather than holding for an all-or-nothing outcome.
After two consecutive failed fade or retest attempts in the same session, stop trading that setup for the day. The market is telling you something your checklist isn’t capturing yet.
Pro Tip: Keep a simple log of your scorecard totals next to your trade outcomes. After 30 to 50 trades, you’ll see exactly which score threshold actually predicts a winner for your instrument and timeframe, which beats any generic rule.
How Big Move Algo Fits Into the Checklist
Running five checks by hand under time pressure is where most traders slip. Big Move Algo’s Fake Trend Detector was built around that exact gap, screening for the volume, structure, and session conditions that feed into the scorecard above before a signal ever reaches you.
Use AUTO mode to get a fast first pass on whether current conditions look like genuine breakout territory or a low-quality setup worth skipping.
Switch to Manual mode when you want to layer your own structure and context checks on top of the tool’s read, particularly on higher timeframe trades where the stakes are bigger.
The tool narrows the field and flags weak conditions. It does not replace the stop placement, sizing, and daily loss discipline covered above. Those rules stay on you no matter what software you run.
What I Trust in Live Markets
Patience beats prediction. I’d rather miss a breakout than force one that hasn’t earned a score above 3. Two habits I hold to: skip the first five minutes after any high-impact news print, and size down automatically on every fade, no exceptions. Backtest your own thresholds on a simulator before risking real money on them.
— Steven Hartwell
Try Big Move Algo on Your Next Breakout
Big Move Algo is the alternative to running five manual checks under time pressure every time price approaches a level. Its Fake Trend Detector screens volume and structure conditions in real time, so the scorecard logic in this guide runs in the background instead of in your head while a candle is still forming.

AUTO mode gives you a fast, low-setup read on whether a breakout looks worth trading across multiple markets within TradingView. Manual mode lets more experienced traders layer their own context on top. Either way, test any new signal on a demo account first and keep your own stop and sizing rules in place. Check out Big Move Algo’s current plans and see how the Fake Trend Detector reads the next breakout on your chart.
Sources
For volume thresholds and mechanics, see Investopedia’s breakdown of fakeouts. For timeframe and session data, read For Traders’ guide to false breakouts. For a second checklist framing, review DayTradingToolkit’s pro trader checklist and Equiti’s guide to trading fakeouts. To practice verifying a setup before you enter, see how to verify a trading signal before entering a trade.
This article is general information, not a substitute for advice from a qualified financial advisor. Consult a qualified financial professional about your own circumstances before acting on anything here.
FAQ
What Is the 3-5-7 Rule in Trading?
The 3-5-7 rule is a risk guideline suggesting you risk no more than 3% of your account on any single trade, cap total exposure at 5% across open positions, and target an overall win rate or profit factor that keeps risk under a modest percentage of capital during drawdowns. It’s a sizing framework, not a false breakout signal, but it pairs well with the smaller position sizes recommended for fade trades above.
How Do You Know if It’s a False Breakout?
Run the scorecard: check volume against the 20-period average, confirm whether the bar closed beyond the level or just wicked through it, measure the close distance using ATR, and factor in the trading session. A score of 2 or below strongly suggests a fakeout rather than a genuine break.
What Is the Best Breakout Strategy?
There’s no single best strategy, but the most reliable approach combines a pre-trade checklist (volume, close location, ATR distance) with a clear plan for whether you’ll fade a failed break or wait for a retest before entering, rather than trading the initial poke.
Can You Make $1,000 a Day With Day Trading?
Some day traders do hit that figure on strong days, but it depends heavily on account size, position sizing, and volatility, and it is not a realistic baseline expectation for most traders, especially beginners. Consistent risk management, like the 0.25% to 1% per-trade sizing covered earlier, matters far more to long-term results than any single day’s target.
Recommended
Comments