
Retail Traders: Calculate Spread & Commission Costs From Last 50 Trades

A spread is the built-in gap between the price you buy at and the price you sell at, charged automatically on every trade. A commission is a separate, itemized fee your broker bills per lot or per side. Spread-only accounts are simpler and often fine for occasional traders, while raw spread plus commission accounts usually save money if you trade often or in size. Skip ahead to the worked example to run the numbers on your own trade size.
TL;DR:
High-volume traders generally benefit from raw spread accounts with low or zero commissions, as they can save more over time despite higher per-trade costs.
Occasional traders often find spread-only accounts more economical since commissions can outweigh the spread costs at smaller lot sizes.
Running the actual cost calculations based on your trade size and frequency is essential, as the cheaper headline spread may not be cheaper in practice once fees are included.
Broker fee transparency varies; always confirm if commissions are per side or round-trip, and account for additional costs like swap and currency conversion fees.
Using better trade discipline and automation can reduce unnecessary costs by minimizing impulsive entries and exits that rack up spread and commission expenses.
Table of Contents
How Spreads Work: Bid/Ask, Fixed vs. Variable, and Pip Math
Every forex quote shows two prices: the bid (what you sell at) and the ask (what you buy at). On EUR/USD, a quote of 1.1000/1.1002 means a 0.2 pip spread, and you’re already down that amount the instant you open a position. That’s the bid/ask spread at work, and it never shows up as a line item on your statement. It’s just baked into the price.
Brokers offer two spread structures. Fixed spreads stay the same regardless of market conditions, which sounds appealing until you notice the tradeoff: fixed-spread brokers sometimes requote or slip during volatility instead of widening the price. Variable spreads move with liquidity and tend to blow out around high-impact news releases or during thin overnight sessions, then tighten back up when volume returns.
Turning pips into dollars is simple once you know the lot size:
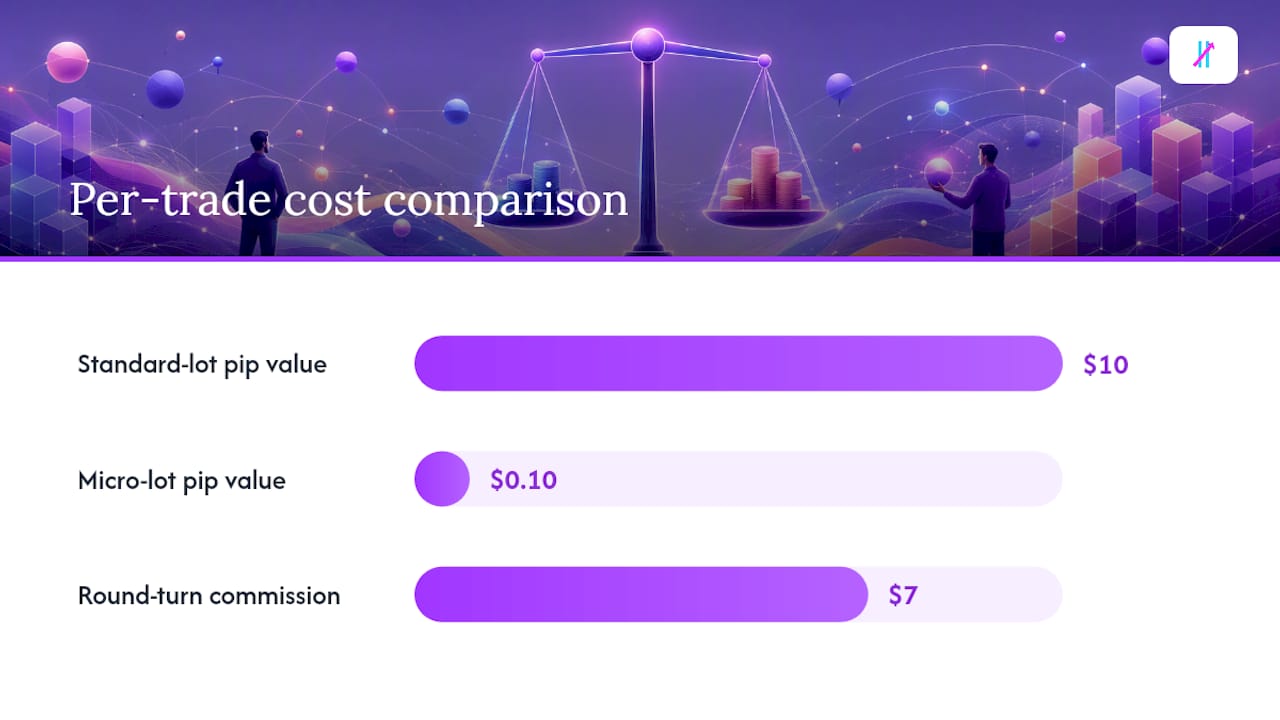
Standard lot (100,000 units): roughly $10 per pip on USD-quoted pairs
Mini lot (10,000 units): roughly $1 per pip
Micro lot (1,000 units): roughly $0.10 per pip
A pip spread on a standard lot costs an amount proportional to the pip value the moment you enter and exit. That’s not a fee you’ll see itemized. It’s already gone, and it’s the reason “zero commission” marketing can be misleading without checking the full pricing structure behind it.
How Commissions Work and What They Typically Cost
A commission is a flat, disclosed fee charged separately from the spread, usually tied to trade size rather than price movement. Some brokers bill it per side (once on entry, once on exit), while others charge a single round-turn fee that covers the whole trade. Reading the fine print on which model you’re getting matters, because a “$3 commission” per side is a very different number than “$3 round-turn.”
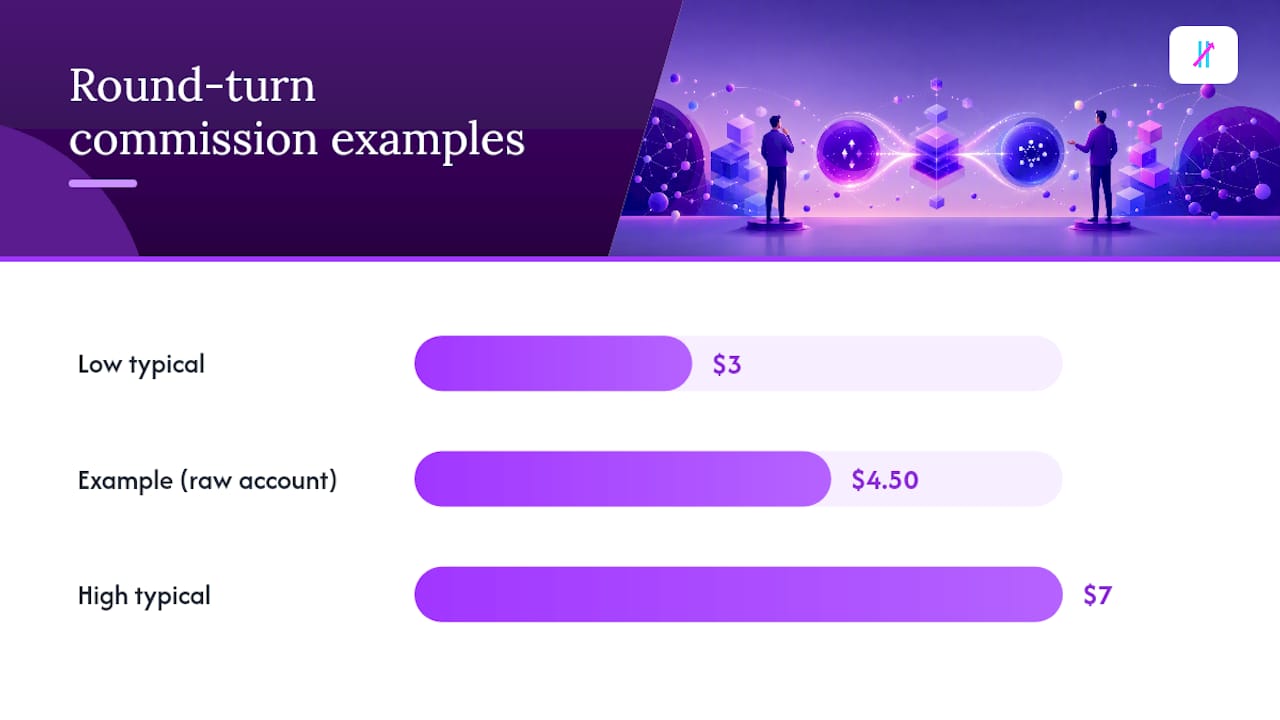
Typical commission ranges on standard-lot forex trades run about $3 to $7 round-turn, often paired with raw spreads near 0.0 to 0.1 pips on major pairs. Some brokers advertise “Zero” or “Raw” account tiers built exactly this way, for example pairing a 0.0 pip spread with a roughly $4.50 round-turn commission.
This model exists mainly because of transparency. ECN and STP brokers route your order directly into the interbank liquidity pool and pass the raw price through, then charge their markup as a visible fee instead of hiding it in the spread. That transparency is the whole point: you can see exactly what the broker earns on each trade, rather than guessing how much markup got folded into the quote.
Commissions are usually quoted per lot, not per dollar traded
Round-turn billing covers both the open and close of a trade
Account currency matters. A commission quoted in USD works differently in a EUR or GBP base account
Calculating Your Real Cost Per Trade
The formula is straightforward: total cost = (spread in pips × pip value × number of lots) + commission + any other fees. Run that math before you pick an account type, because the “cheaper” option on paper isn’t always cheaper for your actual trade size.
Here’s how a single standard lot round-turn compares under the two most common pricing setups:
Account Type | Spread Cost | Commission | Total Cost (1 Standard Lot) |
Spread-only | about $10 per pip on a standard lot | $0 | total cost |
Raw spread + commission | small pip spread × pip value | typical round-turn commission | total cost |
At one standard lot, the raw plus commission account can edge out the spread-only account by a few dollars. That gap looks small until you scale it. Traders with much volume can save significantly, which adds up fast over time.
Commissions hit small trades harder in relative terms. A $7 round-turn fee on a micro lot, where a pip is worth just $0.10, can dwarf the spread cost entirely. If you’re trading micro or mini lots occasionally, a spread-only account with a wider but commission-free structure sometimes works out cheaper overall. Run the same formula at your actual lot size before assuming the raw-spread account wins.
Pro Tip: Pull your last month of trade confirmations and total the actual spread cost plus commissions paid. Most traders are surprised by how much larger the number is than they expected, especially once swap fees get added in.
Which Account Type Fits Your Trading Style
Your trade frequency and average lot size decide this, not personal preference.
Scalpers and high-frequency traders should lean toward raw spread plus commission accounts. When you’re opening dozens of trades a day, even a half-pip difference multiplied across that volume dwarfs a flat per-lot fee, and tighter raw pricing paired with itemized commissions usually wins over time.
Swing and position traders who hold trades for days or weeks and place a handful of orders a month often do better on spread-only accounts. The convenience of one all-in price outweighs the marginal savings from a raw account when you’re not trading often enough to hit meaningful volume.
Occasional or part-time traders should run the numbers on both models before committing, since low volume erases most of the commission-side advantage.
Whichever model you choose, don’t fixate on the headline spread number alone. Execution quality including slippage, requotes, and how deep the broker’s liquidity pool actually is can cost you more than the difference between a 0.8 pip and a 1.2 pip spread ever will.
A Checklist for Comparing Broker Fee Schedules
Brokers love to advertise their tightest possible spread. That number rarely reflects what you’ll pay in live market conditions.
Compare average spreads, not the minimum or “as low as” figure quoted on the marketing page
Confirm whether commission is billed per side or round-turn, since that doubles the effective cost if you misread it
Check for swap or rollover fees on positions held overnight, which vary by currency pair and direction
Watch for currency conversion fees, sometimes around 0.5%, plus withdrawal or inactivity charges that never show up in the spread comparison
Request a sample trade statement or run a demo account for a week to see real fills against real spreads, not marketing copy
Even brokers with genuinely low advertised costs, like Interactive Brokers’ commission-free listings on many US-listed stocks, still carry other fees elsewhere in the schedule. Read the whole fee page, not just the headline.
Reducing Fee Drag With Better Trade Discipline
Fees don’t just come from pricing structure. They come from overtrading: entering positions on noise, exiting early on emotion, then paying spread and commission again to re-enter. Clear Long, Short, and Exit signals, backed by automated execution, cut down on the impulsive trades that quietly rack up fees. A Fake Trend Detector that filters weak setups before you’re tempted to click “buy” does the same job from a different angle. No software changes what your broker charges, but fewer bad trades means fewer times you pay for one.
What I’d Actually Do Before Switching Accounts
Pull your last 50 trades and calculate the real spread and commission cost against what you’d have paid under the other model. Run a backtest that includes spreads, commissions, and swap fees, not just entry and exit prices, because a strategy that looks profitable on raw price data can lose money once real costs are added. If you’re still unsure which account type fits, demo it for a few weeks before committing real capital.
— Steven Hartwell
Trade With Fewer, Better Entries
Every pip and every commission dollar adds up faster when you’re entering trades on impulse instead of structure. This type of trading tool provides clear Long, Short, and Exit signals in real time, so you’re paying spreads and commissions on setups worth taking, not on noise.

The built-in Fake Trend Detector filters out low-quality market conditions before you risk a fee-bearing entry, and AUTO Mode handles execution so emotional overtrading stops draining your account one small loss at a time. It won’t change your broker’s fee schedule, but it can change how often you pay it. Check current subscription plans and pricing to get instant access and start running tighter, more disciplined entries today.
This article is general information, not a substitute for advice from a qualified financial advisor. Consult a qualified financial professional about your own circumstances before acting on anything here.
Sources
FAQ
Is Raw Spread With Commission Better Than No Commission?
Neither wins universally. Raw spread plus commission usually costs less for high-volume or scalping traders, while spread-only accounts tend to suit occasional or smaller-lot traders better.
How Much Does a Spread Actually Cost?
On a standard lot, each pip of spread runs about $10 on USD-quoted pairs, so a spread costs roughly $10 per pip before any commission is added.
Can You Realistically Make $1,000 a Day Day Trading?
It depends entirely on account size, position sizing, and strategy edge, and spreads or commissions eat directly into that target. A trader running several standard lots per day easily loses $50 to $100 to costs alone before counting a single losing trade.
How Much Do Traders With $50,000 Accounts Typically Make Per Day?
There’s no reliable universal figure, since results vary wildly by strategy, risk management, and market conditions. What’s consistent is that fee drag from spreads and commissions scales with trade frequency, so high-volume strategies need a tighter cost structure to stay profitable.
Does Big Move Algo Help Lower My Trading Costs?
Big Move Algo doesn’t change what your broker charges, but its Long, Short, and Exit signals plus Fake Trend Detector help cut down on the low-quality, impulsive trades that quietly add up in spreads and commissions over time.
Recommended
Comments