
How to Trade Stocks Using Technical Signals
- Steven Hartwell

- Jul 7
- 8 min read

Trading stocks using technical signals means applying mathematical indicators derived from price and volume data to identify probable market movements and time your entries and exits. Technical analysis, the formal discipline behind this practice, studies historical price and volume data to forecast price movements. The core insight most retail traders miss is this: no single indicator predicts the future. The real edge comes from combining complementary tools, each measuring a different aspect of market behavior, so your signals confirm each other before you act. Indicators like RSI, moving averages, Bollinger Bands, and ATR each serve a distinct purpose, and knowing how to layer them is what separates disciplined traders from gamblers.
What are the most effective technical indicators for stock trading?
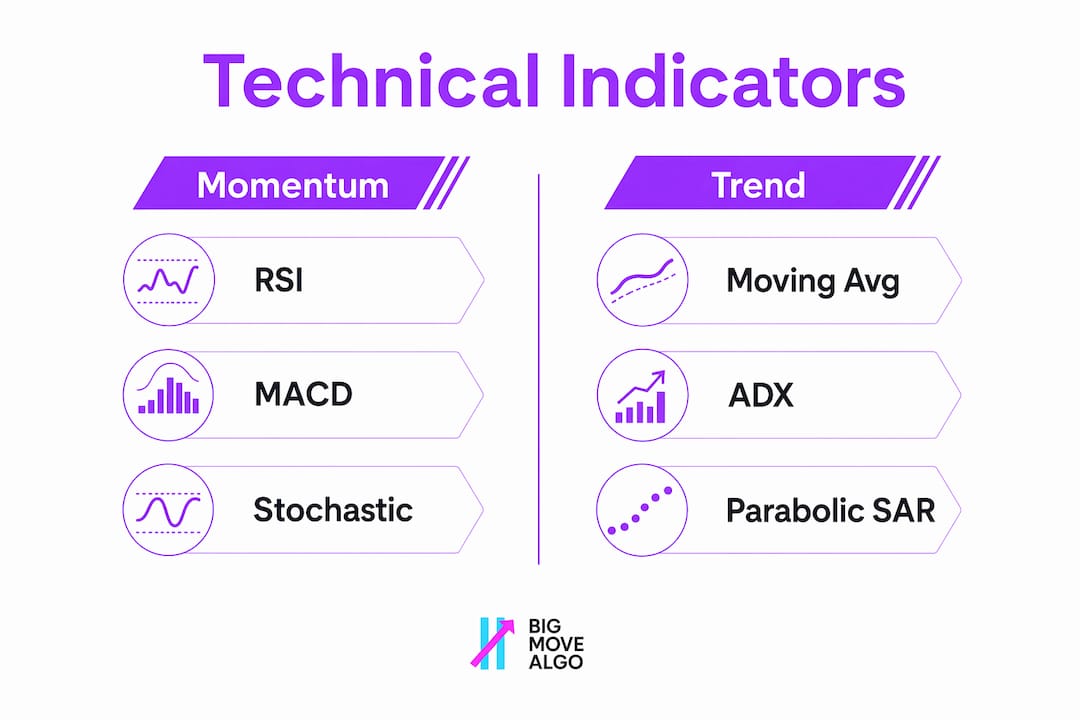
Technical indicators fall into four categories: momentum, trend, volatility, and volume. Each category answers a different question about the market. Using one from each category gives you a complete picture without redundancy.
Momentum indicators
The RSI (Relative Strength Index) is the most widely used momentum indicator. It runs on a 0–100 scale, with readings above 70 signaling overbought conditions and readings below 30 signaling oversold conditions. That means when RSI crosses above 70, buying pressure has likely stretched too far and a pullback becomes probable. RSI works best when combined with a trend indicator, not used alone.
Trend indicators
Moving averages reduce price noise and define the overall trend direction. They act as low-pass filters, smoothing out short-term fluctuations to reveal the underlying direction. The key limitation is that they lag. A 50-day moving average tells you what has already happened, not what comes next. Use moving averages on higher timeframes to establish trend direction, then drop to a shorter timeframe to time your entry.

The ADX (Average Directional Index) measures trend strength rather than direction. An ADX reading above 25 typically signals a strong trend worth trading. Below 20, the market is likely choppy and trending strategies will underperform.
Volatility and volume indicators
Bollinger Bands mark the outer edges of normal price behavior. When price stretches beyond the bands, it signals instability. The correct approach is to wait for price to stabilize back inside the bands before entering a trade. Acting on the stretch itself produces a high rate of false signals.
ATR (Average True Range) measures how much a market moves on average over a set period. It does not generate buy or sell signals. Instead, ATR sets stop distances outside normal price noise, which is the most practical use of any volatility tool.
Volume indicators confirm whether a price move has real participation behind it. Volume spikes confirm breakouts, but their reliability depends on the liquidity of the asset you are trading. A breakout on thin volume is a warning sign, not a green light.
Indicator type | Primary role | Best used for |
RSI (momentum) | Measures buying and selling pressure | Spotting overbought or oversold conditions |
Moving averages (trend) | Defines trend direction | Higher timeframe bias and crossover signals |
ADX (trend strength) | Measures how strong a trend is | Filtering choppy vs. trending markets |
Bollinger Bands (volatility) | Identifies price extremes | Timing entries after price stabilizes |
ATR (volatility) | Measures average price range | Setting stop-loss distances |
Volume indicators | Confirms price moves | Validating breakouts and momentum |
Pro Tip: Limit your chart to one indicator from each category. Four well-chosen tools give you more clarity than ten overlapping ones.
How to combine multiple technical indicators for a reliable strategy
The principle behind combining indicators is layering by function, not stacking by count. Using multiple momentum oscillators simultaneously does not improve signal quality. It just repeats the same information in different visual formats. The goal is to have each indicator answer a different question.
The three-layer framework works like this. The first layer identifies trend direction using a moving average or ADX. The second layer confirms momentum using RSI. The third layer times the entry using Bollinger Bands or a candlestick pattern. Each layer filters out trades the previous layer would have accepted.
Effective combinations include Bollinger Bands paired with RSI, Bollinger Bands paired with ADX, and moving averages paired with ADX. These complementary pairings work because they measure different things. Bollinger Bands measure volatility. RSI measures momentum. ADX measures trend strength. Together, they cover the full picture.
Here is a step-by-step process to build a combined-indicator strategy:
Define the trend. Use a 50-day or 200-day moving average to establish whether the market is in an uptrend or downtrend on your primary timeframe.
Confirm trend strength. Add ADX. Only trade in the direction of the trend when ADX reads above 25.
Check momentum. Use RSI to confirm that momentum aligns with the trend. In an uptrend, look for RSI pulling back toward 40–50 before entering long, rather than chasing a reading above 70.
Time the entry. Watch Bollinger Bands for price returning inside the bands after a stretch, which signals that volatility has settled.
Set your stop. Use ATR to place your stop at a distance that accounts for normal market noise, typically 1.5x to 2x the ATR value.
Define your exit. Set a target based on a prior resistance level or a fixed risk-to-reward ratio before you enter the trade.
Pro Tip: Write your strategy rules down before you trade. If you cannot explain your entry and exit criteria in two sentences, the strategy is not clear enough yet.
How to execute trades step by step using technical signals
Execution starts before you open a chart. Select your indicators, set your parameters, and decide which timeframe matches your trading style. Day traders typically work on 5-minute to 1-hour charts. Swing traders use daily or weekly charts. The timeframe determines how you interpret every signal.
Reading signals correctly requires understanding what each signal type means. A moving average crossover, where a short-term average crosses above a long-term average, signals a potential trend shift. An RSI reading below 30 in a confirmed uptrend signals a buying opportunity, not a warning to sell. Context changes the meaning of every reading.
Confirmation techniques reduce false entries. A volume spike alongside a breakout tells you real buyers are participating. A bullish candlestick pattern at a moving average support level adds a third layer of confirmation. The more conditions align, the higher the probability of a successful trade.
Risk management is not optional. ATR-based stops keep you in trades through normal volatility while cutting losses when the market moves against you decisively. Position sizing should be calculated so that a stop-loss hit costs no more than 1%–2% of your total account on any single trade. That rule alone keeps losing streaks from becoming account-ending events.
Execution approach | Signal type | Confirmation needed | Risk tool |
Trend following | Moving average crossover | ADX above 25, volume confirmation | ATR-based trailing stop |
Momentum entry | RSI pullback in uptrend | Price at moving average support | Fixed ATR stop below support |
Volatility breakout | Price outside Bollinger Bands | Volume spike, RSI not extreme | ATR stop inside the bands |
Mean reversion | RSI overbought or oversold | Bollinger Band stretch, candlestick reversal | Tight ATR stop at entry level |
Common mistakes to avoid when trading with technical signals
The most damaging mistake retail traders make is treating indicators as standalone predictive tools. Indicators tell you what has happened, not what will happen next. That distinction changes how you use them. They are gauges of market context, not crystal balls.
The second most common mistake is indicator overload. Adding more indicators does not reduce uncertainty. It creates analysis paralysis. Experts recommend limiting your chart to 3–4 indicators to maintain clarity and make faster, cleaner decisions.
Watch out for these specific traps:
Chasing lagging signals. Moving averages confirm trends after they start. Entering late in a move because a crossover just appeared puts you at the worst possible risk-to-reward ratio.
Ignoring market regime. A momentum strategy that works in a trending market will fail in a range-bound market. Always check ADX before applying a trend-following approach.
Skipping risk management. A strong signal does not eliminate risk. Every trade can fail. Position sizing and stops are non-negotiable regardless of how confident the setup looks.
Overtrading. Waiting for all three layers of your strategy to align will mean fewer trades. Fewer, higher-quality trades outperform a high volume of marginal ones over time.
“Successful traders do not treat indicators as buy/sell buttons. They wait for price stability or structural breaks confirmed by multiple signals to minimize false trades.”
Pro Tip: Before going live, run your strategy on historical charts for at least 20–30 past setups. If it does not work on past data, it will not work in real time.
Key Takeaways
Trading stocks with technical signals works when you layer complementary indicators by function, confirm entries with multiple conditions, and apply strict risk management on every trade.
Point | Details |
Layer by function, not count | Use one indicator each for trend, momentum, volatility, and volume to avoid redundant signals. |
Confirm before entering | Wait for at least two conditions to align, such as ADX above 25 and RSI at a pullback level. |
Use ATR for stops | Set stop-loss distances based on ATR to account for normal market noise, not arbitrary round numbers. |
Limit your indicator count | Three to four well-chosen indicators outperform a crowded chart with ten overlapping tools. |
Treat signals as context, not predictions | Indicators reflect what has happened in the market. They inform decisions but do not guarantee outcomes. |
Why simplicity wins in technical signal trading
After watching retail traders struggle with their charts for years, the pattern I see most often is not a lack of knowledge. It is a lack of discipline in applying what they already know. Traders who read every book on RSI and Bollinger Bands still blow up accounts because they break their own rules the moment a trade goes against them.
The traders I have seen succeed consistently share one habit: they use fewer tools and follow them more strictly. They pick a moving average, an RSI, and an ATR-based stop, and they do not deviate. When the setup is not there, they do not trade. That sounds simple, but it is genuinely hard to execute when you are watching a market move without you.
The other thing I would push back on is the idea that more sophisticated analysis produces better results. The Efficient-Market Hypothesis argues that indicators cannot guarantee profit because prices already reflect available information. That does not make technical analysis useless. It means you should use it as a risk management framework, not a profit guarantee. The goal is to put probability on your side, not to find a magic formula.
My honest advice: build a three-layer system, test it on 30 historical setups, and trade it for 60 days without changing anything. Only then will you have real data on whether it works for you. Patience is not a soft skill in trading. It is the actual edge.
— Steven Hartwell
Putting technical signal trading into practice
Knowing the theory is one thing. Getting clear, real-time signals on a live chart is another challenge entirely. Big Move Algo is a TradingView indicator built for retail traders who want structured signals without the complexity of managing multiple overlapping tools manually.

Big Move Algo delivers Long, Short, and Exit signals in real time, with a built-in Fake Trend Detector that filters out low-quality market conditions where trading is not recommended. The AUTO Mode gets you up and running with minimal setup, while Manual Mode gives experienced traders room to customize. Whether you trade stocks, forex, crypto, or indices, the tool applies the same signal logic across markets. Learn more about how automated trade signals work, or explore how signals are calculated before you commit. Visit Big Move Algo to see current subscription plans.
FAQ
What does it mean to trade stocks using technical signals?
Trading stocks using technical signals means using mathematical indicators derived from price and volume data to identify entry and exit points. These signals include crossovers, overbought or oversold readings, and volatility breakouts.
How many indicators should I use on one chart?
Experts recommend using 3–4 indicators, each from a different category such as trend, momentum, and volatility. Using more than four typically creates conflicting readings and slows decision-making.
What is the best combination of technical indicators for stocks?
Effective combinations include Bollinger Bands with RSI, and moving averages with ADX. These pairings work because each indicator measures a different aspect of market behavior, reducing redundancy.
How do I set a stop-loss using technical signals?
Use ATR to calculate your stop distance. Place your stop 1.5x to 2x the ATR value away from your entry point so normal price fluctuations do not trigger an exit before the trade has a chance to develop.
Can technical signals guarantee profitable trades?
No. Technical indicators reflect past price behavior and help assess market context, but they do not predict future price movements with certainty. They are tools for improving probability, not eliminating risk.
Recommended
Comments