
Trade US Stock Market Open Signals: 2026 Guide
- Steven Hartwell

- Jul 8
- 8 min read

Trading US stock market open signals is defined as the practice of analyzing pre-market data, key price levels, and institutional order flow to identify high-probability trade entries at the 9:30 AM ET opening bell. The industry term for this practice is “opening bell trading strategy,” and it sits at the intersection of technical analysis, volume study, and market timing. Retail traders who master this process gain a measurable edge over those who react blindly to price movement. This guide covers the full process: pre-market preparation, signal interpretation, common mistakes, and the tools that make it work.
What are the best ways to trade US stock market open signals?
The foundation of trading open signals is preparation, not reaction. Traders who arrive at 9:30 AM without a plan are already behind. The pre-market window, specifically 7:00–8:30 AM ET, is where the real work happens.
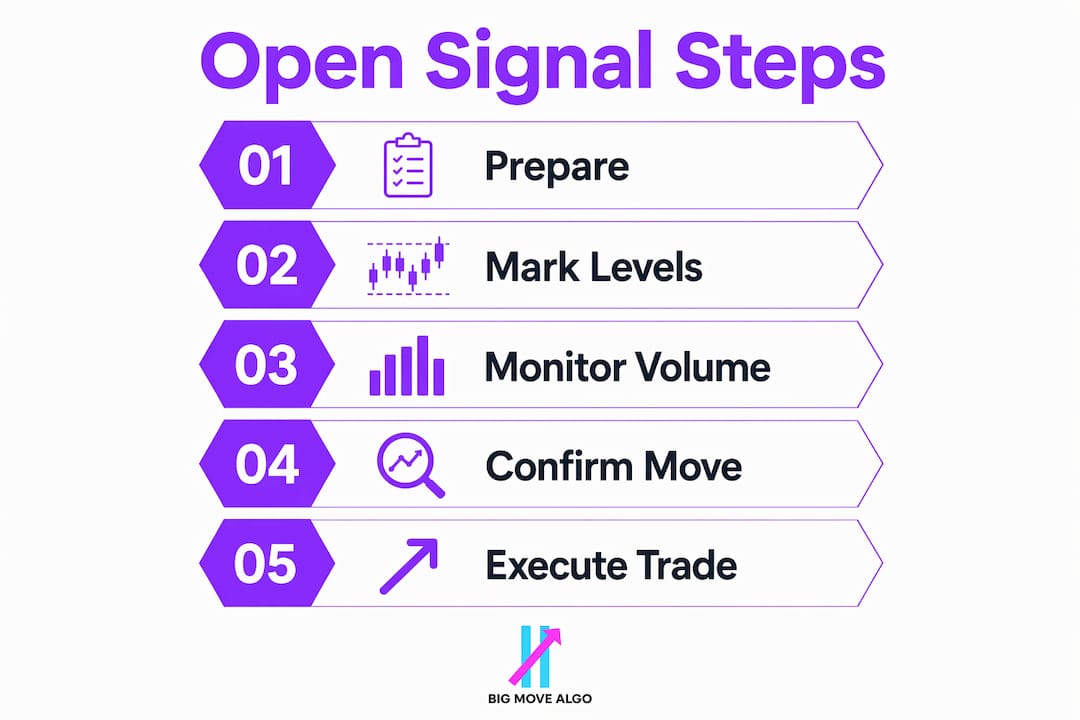
A structured pre-market routine covers five core areas:
Scan equity futures (S&P 500, Nasdaq, Dow) to gauge overall market bias before the open.
Review the economic calendar for scheduled releases: CPI, Fed statements, jobs reports, and earnings announcements that move sectors.
Mark key technical levels on your watchlist stocks: previous day’s high and low, pre-market high and low, and VWAP (Volume Weighted Average Price).
Assess pre-market volume. Stocks with volume 2x–10x above average signal strong institutional interest. That interest often drives the first directional move after the open.
Apply float criteria. Stocks with floats under 50 million shares move faster and farther on volume spikes. They produce cleaner signals but carry more risk.
Building your watchlist
Limit your watchlist to 3–5 stocks. Focusing on fewer stocks improves execution quality and decision speed during high-volatility periods. Tracking 15 tickers at once guarantees you miss the best setup on all of them.
Use a stock screener to filter by gap percentage, relative volume, and float size. A stock gapping up 5% on 5x normal volume with a 20-million-share float is a candidate. A stock gapping 0.5% on average volume is not.
Pro Tip: Mark your key levels the night before, not the morning of. Pre-market price action moves fast. Having levels already drawn lets you focus on reading price, not drawing lines.

Platforms like TradingView support real-time chart customization that makes this level-marking process faster and more consistent across multiple tickers.
How do you identify high-quality signals during the market open?
The first 15 minutes after the open, from 9:30 to 9:45 AM ET, are the most dangerous for retail traders. Extreme volatility and wide spreads make entries unreliable during this window. Institutional orders flood the market, creating sharp moves that reverse without warning.
The optimal entry window is 9:45–10:30 AM ET. By this point, volatility settles and directional momentum confirms. Waiting for this window filters out false signals caused by order imbalances and emotional reactions from retail traders who jumped in at 9:30.
The three most reliable open signals are:
Break above pre-market high: A break above pre-market high at 9:35 AM often triggers the first momentum move. When confirmed with volume, it signals institutional buying and aligns with liquidity pools.
Break below pre-market low: The mirror signal. A clean break below the pre-market low on rising volume signals distribution and often leads to a sustained move lower.
VWAP cross: Price crossing above VWAP signals bullish bias. Price crossing below signals bearish bias. VWAP acts as the institutional reference price for the day.
Reading volume to confirm direction
Volume is the confirmation layer. A price break without volume is a trap. A price break with volume 2x or more above the session average is a signal worth acting on.
Institutional order flow drives directional moves at the open. Retail traders who align with that flow, rather than fight it, consistently produce better results. Check whether the broader market (S&P 500 futures, for example) supports the direction of your individual stock signal. A bullish signal on a stock while the S&P 500 is selling off carries significantly more risk.
Pro Tip: Use a 1-minute chart to spot the initial move, then confirm on a 5-minute chart before entering. The 5-minute candle close above or below a key level is a stronger signal than a 1-minute wick.
What mistakes should you avoid when trading stock market open signals?
Most costly retail mistakes happen in the first 5–10 minutes after the open. Patience during the opening drive while institutional positioning completes increases your probability of winning. The traders who lose consistently are the ones who cannot wait.
The most common errors include:
Trading at exactly 9:30 AM. Spreads are wide, volume is chaotic, and price action is unreliable. This is the single most expensive habit in retail trading.
Over-relying on news. News creates context, not entries. Over-reliance on news causes analysis paralysis. Time-box your news review to 10 minutes and shift focus to technical levels.
Ignoring broader market context. Trading a long signal on a stock while the Nasdaq is dropping 1.5% is trading against institutional flow. The broader market wins most of the time.
Watching too many stocks. Cognitive overload at the open leads to late entries, missed stops, and poor execution. Three to five stocks is the professional standard.
Trading without an if/then plan. “If price breaks above $47.50 on volume, I buy. If it fails and closes back below, I exit.” That structure removes emotion from the decision.
“A solid pre-market routine includes clearly defined if/then trade plans to reduce over-analysis and automate decision-making under pressure. Professionals use time-boxed routines of 30–45 minutes to prepare and enter the market with a predefined plan, avoiding emotional mistakes.” — metatradingclub.com
Risk management is not optional. Define your maximum loss per trade before the open. If a trade hits that level, you exit. No exceptions, no hoping for a reversal. That discipline separates traders who last from those who blow up accounts in their first month.
Which tools and indicators work best for analyzing open signals?
The right tools reduce noise and surface the signals that matter. No single indicator works in isolation. The strongest setups combine two or three confirming signals.
The core toolkit for trading US market open trends includes:
VWAP: The single most important intraday indicator. Price above VWAP is bullish. Price below is bearish. Institutional desks use VWAP as a benchmark, which makes it a self-fulfilling reference point.
9 EMA and 20 EMA: The 9-period exponential moving average tracks short-term momentum. The 20-period tracks the broader intraday trend. When price holds above both, the trend is up. When price breaks below both, the trend is down.
Pre-market volume scanners: These filter stocks by gap percentage, relative volume, and float size before the open. They surface the candidates worth watching.
Tool category | Primary use | Best for |
Volume scanner | Pre-market stock selection | Finding high-probability candidates |
Chart analysis (VWAP, EMA) | Signal confirmation | Timing entries and exits |
Algo signal generator | Real-time Long/Short/Exit signals | Reducing manual analysis load |
Algo-based signal generators, like Big Move Algo, sit in the third category. Big Move Algo is a TradingView indicator that delivers real-time Long, Short, and Exit signals. Its built-in Fake Trend Detector filters out low-quality setups where the signal is misleading. That filter alone prevents a significant number of bad trades during the chaotic early minutes of the session.
Traders who want to understand how buy and sell signals are calculated will find that the best systems combine price action, volume, and trend confirmation rather than relying on a single data point. Automated trade signals remove the emotional layer from signal reading, which is where most retail traders lose their edge.
Key Takeaways
Trading US stock market open signals requires a structured pre-market routine, disciplined timing in the 9:45–10:30 AM ET window, and volume-confirmed technical signals to produce consistent, high-probability trade entries.
Point | Details |
Optimal entry window | Trade between 9:45 and 10:30 AM ET when volatility settles and momentum confirms. |
Pre-market preparation | Start your routine at 7:00–8:30 AM ET; mark VWAP, pre-market high/low, and previous day’s levels. |
Volume confirms signals | Only act on breakouts supported by volume 2x or more above the session average. |
Limit your watchlist | Track 3–5 stocks maximum to maintain focus and execution quality at the open. |
Use if/then trade plans | Define entry, exit, and stop criteria before the open to remove emotion from decisions. |
Why patience is the real edge at the open
Retail traders spend enormous time searching for the perfect indicator. I spent years doing the same thing. The uncomfortable truth is that the edge at the open is not a better tool. It is better timing and better discipline.
The traders I have watched succeed consistently share one habit: they do not trade the first 15 minutes. They watch. They let the institutional orders clear. They let the false breakouts trap the impatient traders. Then they enter when the picture is clear. That patience is worth more than any indicator.
Technology matters, but it plays a supporting role. I use algo-generated signals to surface setups faster and reduce the cognitive load of scanning multiple charts simultaneously. But I still confirm manually. A signal that does not align with the broader market context, or that appears on thin volume, gets skipped regardless of what the indicator says.
The traders who struggle most are the ones chasing every signal. Quality setups are rare. On a given day, there might be one or two genuinely clean opportunities in the 9:45–10:30 AM window. Taking those two trades well beats taking eight mediocre trades poorly. The math on that is not close.
Market dynamics in 2026 have made institutional order flow even more dominant at the open. Algorithmic trading from large funds now accounts for a substantial share of early-session volume. That means the pre-market high and low levels, and VWAP, are more respected than ever. They are the levels where institutional algorithms are programmed to act. Retail traders who learn to read those levels trade with the flow, not against it.
— Steven Hartwell
How Big Move Algo fits into your open signal strategy
Real-time signal clarity is the gap between a good pre-market routine and a profitable trade execution.

Big Move Algo delivers Long, Short, and Exit signals directly on your TradingView charts, updated in real time as the market moves. The AUTO Mode requires minimal setup, making it practical for traders who want signal clarity without spending an hour configuring settings before the open. The Fake Trend Detector filters out the low-quality, misleading conditions that are especially common in the first 30 minutes of the session. For traders who want to see live trading signal examples before committing, the Big Move Algo website at bigmovealgo.com shows exactly how signals appear in real market conditions. Subscription plans include instant access after purchase through Stripe.
FAQ
What is the best time to trade US stock market open signals?
The optimal window is 9:45–10:30 AM ET. The first 15 minutes after the open feature extreme volatility and wide spreads that make reliable entries difficult for retail traders.
What does VWAP tell you at the market open?
VWAP (Volume Weighted Average Price) shows the average price weighted by volume for the session. Price above VWAP signals bullish bias; price below signals bearish bias, and institutional desks use it as a key reference level.
How many stocks should I watch at the market open?
Limit your watchlist to 3–5 stocks. Tracking more than five tickers simultaneously creates cognitive overload and degrades execution quality during high-volatility periods.
What is a pre-market high/low breakout signal?
A pre-market high breakout occurs when price moves above the highest point reached before 9:30 AM ET on strong volume. It signals institutional buying and often triggers the first sustained momentum move of the session.
How do if/then trade plans reduce mistakes at the open?
An if/then plan defines your entry, exit, and stop criteria before the market opens. That structure removes real-time emotional decision-making and prevents the reactive mistakes that cost retail traders the most money.
Recommended
Comments