
Trade with Confidence: Clear Entry Signal Templates


A clear entry signal is not a feeling. It is a rule: when X happens, confirmed by Y, enter at Z with a stop at S and size of N. That single sentence is the whole framework. Everything else is just filling in the blanks.
Before you click buy or sell, run this three-item check:
Trend/context confirmed? Price is on the right side of your reference level (moving average, structure high/low, or higher-timeframe bias).
Trigger fired? A specific, observable event occurred: a candle close, a cross, a breakout above a defined level.
Stop and size defined? You know exactly where you are wrong and how many shares, contracts, or units that translates to at your chosen risk per trade.
If any box is unchecked, there is no trade.
Entry template (copy into your chart notes):Entry: [price] | Stop: [price] | Size: [units] | Target: [price] | Rule: [template name]
Pro Tip: Write the stop before you write the entry. Traders who define risk first almost never chase entries.
Table of Contents
What makes a clear entry signal?
Four components separate a tradable signal from a hunch. Miss one and you have introduced ambiguity, which is where emotional decisions live.
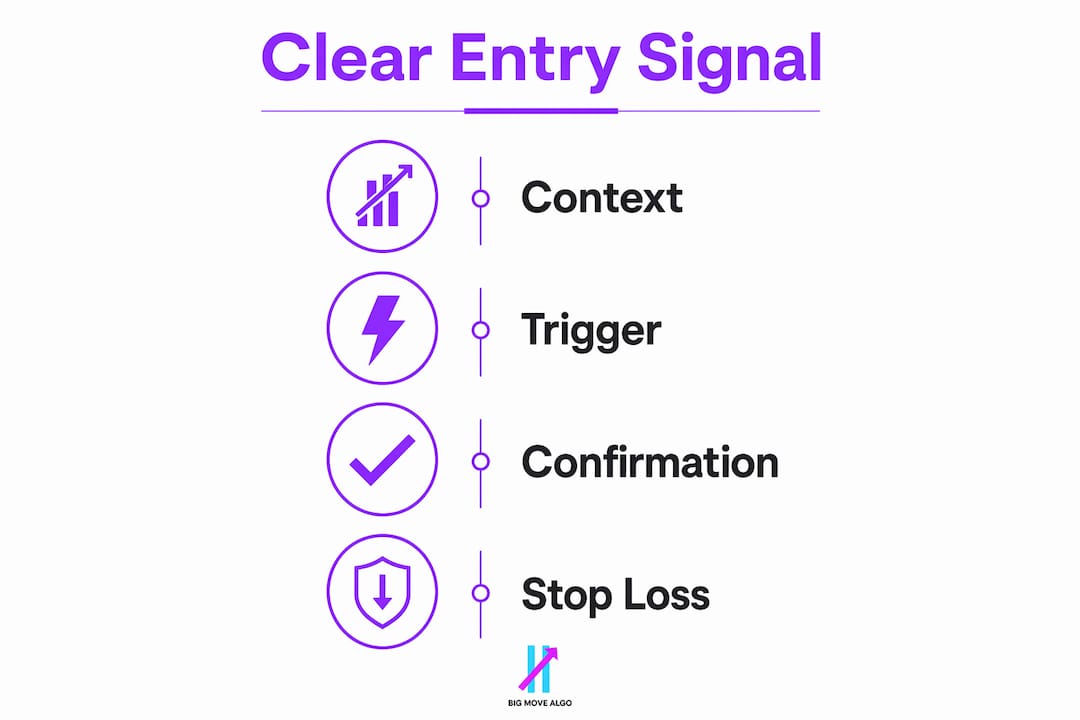
1. Context (trend or range bias) This is the backdrop. Is price in an uptrend, downtrend, or a defined range? Acceptable evidence: a 20-period EMA sloping upward with price above it, a series of higher highs and higher lows on the daily chart, or a clearly bounded horizontal range on the 1-hour. Context tells you which direction is favored and which signals to ignore.
2. Trigger The trigger is the specific, observable event that starts the trade. Examples: a 9/21 EMA cross, a candle closing above a resistance level, or a momentum oscillator crossing its signal line. The trigger must be binary. Either it happened or it did not.

3. Confirmation One signal can lie. Confirmation is a second, independent piece of evidence that agrees with the trigger. A volume spike above the 20-period average on a breakout candle. A higher-timeframe trend aligned with the lower-timeframe trigger. A candlestick pattern (engulfing, pin bar) at a key level. Confirmation reduces false entries without requiring a perfect setup.
4. Predefined stop and target (with position size) Signal clarity is more useful than raw signal accuracy. Defining exits and risk before entering forces you to know when your thesis is wrong. Stop placement: below the last swing low for longs, above the last swing high for shorts, or beyond the range boundary for mean-reversion trades. Target: a minimum 1.5:1 reward-to-risk ratio, ideally 2:1 or better. Position size follows from the stop distance and your fixed risk amount per trade.
Pro Tip: Convert every subjective observation into an objective rule. “The trend looks strong” becomes “price is above the 50 EMA on the daily and the 4-hour.” One is a feeling; the other is a rule you can backtest.
Signal clarity stat: According to signal clarity research, filtering bad market conditions, including low-volume sessions and sudden regime changes, significantly reduces false breakouts and fake trends. Clarity of conditions matters as much as the signal itself.
Three rule-based entry templates you can test today
Template A: Trend-following entry
Best timeframes: 1-hour, 4-hour, daily
Context: Price is above the 21 EMA on the trading timeframe AND above the 50 EMA on the next higher timeframe.
Trigger: The 9 EMA crosses above the 21 EMA (for longs), confirmed by a candle close above both.
Confirmation: RSI(14) is above 50 and rising, or volume on the trigger candle exceeds the 20-period average.
Stop: Below the most recent swing low, or 1 ATR(14) below the entry candle’s low.
Target: 2x the stop distance, or the next significant resistance level, whichever comes first.
Position size: Risk 1% of account per trade. Size = (Account × 0.01) ÷ stop distance in dollars.
Avoid: Entering after three or more consecutive trend candles without a pullback. Wait for a retest.
Template B: Breakout entry
Best timeframes: 15-minute, 1-hour (avoid M1 and M5 for this template)
Context: Price has consolidated for at least 8 candles within a range no wider than 1.5 ATR.
Trigger: A candle closes outside the range boundary with a body (not just a wick) beyond the level.
False-break filter: Volume on the breakout candle must be at least 1.5x the 20-period average. If volume is below that threshold, skip the trade.
Confirmation: The next candle opens and holds above (or below) the breakout level without immediately reversing.
Stop: Inside the range, 0.5 ATR from the breakout level.
Target: The range width projected from the breakout point (measured move).
Avoid: Holiday sessions, pre-market hours, and the 30 minutes before major economic releases. Filtering bad market conditions is the single most effective way to cut false breakouts.
Template C: Mean-reversion entry
Best timeframes: 15-minute, 1-hour within a clearly defined daily range
Context: Price is range-bound on the daily chart. Identify support and resistance with at least two prior touches each.
Trigger: Price reaches the support or resistance zone (within 0.25 ATR of the level).
Confirmation: A reversal candlestick pattern (pin bar, engulfing) forms at the zone, AND volume on that candle is above average.
Stop: Beyond the zone by 0.5 ATR (outside the range boundary).
Target: The opposite side of the range, or 1.5x the stop distance, whichever is closer.
Sizing: Because mean-reversion trades carry higher failure risk at extremes, reduce position size to 0.75% of account until the setup has 20 logged trades.
Suggested indicator settings
Template | Primary indicator | Setting | Filter |
Trend-following | EMA cross | 9 / 21 / 50 | RSI(14) > 50, volume > 20-period avg |
Breakout | ATR range check | ATR(14) | Volume ≥ 1.5x avg, body close outside range |
Mean-reversion | Support/resistance zone | Manual or auto S/R | Reversal candle + volume confirmation |
Pro Tip: Keep simple, clear signals on one chart. Adding a fourth or fifth indicator rarely improves results; it usually just creates conflicting reads that freeze you at the entry.
How do you validate that a signal actually works?
Confidence built on untested signals is fragile. The fix is a structured proof process, not more screen time.
The 50-trade proof exercise
The 50-trade proof framework is the most practical way to verify a setup has a real edge. Trade one strictly defined setup for 50 logged trades with consistent risk, then calculate win rate, expectancy, profit factor, and max consecutive losses. Fifty trades is enough to reveal whether a setup has a statistical edge or is just noise.
Backtest protocol (step by step):
Pick one template. Define every rule in writing before you look at historical charts.
Scroll back at least 200 candles on your chosen timeframe and mark every valid setup.
Log entry price, stop price, target price, result (win/loss), and setup type for each trade.
Calculate: win rate, average win/loss ratio, expectancy (win rate × avg win) minus (loss rate × avg loss), and max consecutive losses.
If expectancy is positive across 50+ trades, the setup has a measurable edge.
Forward-test plan:
Paper-trade the setup for 20 trades at full rules before risking real capital.
Move to micro-sized live trades (25% of normal size) for the next 20 trades.
Scale to normal size only after the live results match the backtest expectancy within a reasonable range.
Restart the forward test from paper trading any time you change a rule.
How Big Move Algo maps to this process:
Big Move Algo’s indicator on TradingView enforces the four components automatically. The Long and Short labels are the trigger. The built-in Fake Trend Detector acts as the confirmation layer, flagging low-quality market conditions before you enter. AUTO Mode runs the signal logic without manual parameter adjustments, making it straightforward to run a consistent 50-trade test. MANUAL Mode lets you adjust parameters if you want to test a specific filter. The indicator works across crypto, forex, stocks, indices, and commodities, so you can run the same proof exercise across multiple markets.
Two types of confidence matter here. Analytical confidence is built outside market hours through backtests and review. Execution confidence is built during market hours through repeated, rule-following practice. Both are necessary; neither replaces the other.
Pro Tip: To avoid overfitting, test your setup on data you did NOT use to design the rules. If you built the template by studying 2023 charts, backtest it on 2024 data. A setup that only works on the data it was built from is not an edge.
How do you size and execute each trade without second-guessing?
A valid signal means nothing if the order is wrong. Execution is where most retail traders lose money they should have kept.
Position sizing by account size
Account size | Risk per trade (1%) | Stop distance example | Max position size |
— | $50 | — | — |
— | — | — | 200 shares |
Formula: Position size = (Account × risk %) ÷ stop distance in dollars.
For a more conservative approach, cap risk at 0.5% per trade until you have 50 logged trades confirming positive expectancy. Systematic financial planning principles apply here: size decisions should follow measured data, not gut feel.
Stop placement by template type
Trend-following: Stop below the last swing low (longs) or above the last swing high (shorts). Never place a stop at a round number where liquidity clusters.
Breakout: Stop inside the broken range, 0.5 ATR from the breakout level. If the price re-enters the range, the thesis is invalid.
Mean-reversion: Stop beyond the range boundary. A close outside the range means the range is broken and the trade is wrong.
Order types and when to use them
Limit order: Use for mean-reversion entries at a defined zone. You get the price you planned; you may miss the trade if price doesn’t reach the level.
Stop-limit order: Use for breakout entries. Triggers when price crosses the level, fills at your limit. Reduces chasing but risks partial fills in fast markets.
Market on open (MOO): Use for daily-chart trend entries when the signal fires on the prior day’s close. Fills immediately at the open; accept minor slippage.
Quick execution rules:
Reduce position size by 50% on days with scheduled high-impact news releases.
Use OCO (one-cancels-other) orders to set stop and target simultaneously after entry.
If the entry candle closes more than 1 ATR beyond your planned entry, skip the trade. The risk/reward has already shifted.
Never move a stop against the trade. Adjust only in the direction of profit.
Pre-trade checklist and trade-plan template
Print this or paste it into your journal. Fill it out before every trade, not after.
Pre-trade checklist:
[ ] Context confirmed (trend direction or range boundaries identified)
[ ] Trigger fired (specific, observable event logged)
[ ] Confirmation present (second independent signal agrees)
[ ] Stop level defined (price and dollar amount)
[ ] Position size calculated (dollars at risk ≤ 1% of account)
[ ] News check passed (no high-impact release within 30 minutes)
[ ] Time-of-day filter passed (not in first 15 minutes of session open or last 15 minutes of close for intraday)
One-page trade-plan template (copy into journal or trade ticket):
Date/time:
Market and timeframe:
Template used: (A / B / C)
Entry price:
Stop price:
Target price:
Position size (units and $ at risk):
Reason for entry (one sentence):
Rule followed? (Y/N):
Post-trade note: (What happened? Did price behave as expected?)
Journal prompt questions (answer after closing the trade):
Did I follow every rule on the checklist, or did I skip a step?
If I skipped a step, what was the reason?
Would the trade result have been different if I had followed the rule?
What is one thing I will do differently on the next trade?
Capital.com’s research confirms that disciplined logging and metric review, treating wins and losses equally as data, is the most consistent path to stable trading confidence. Log both. Review both. The failed trades teach more than the winners.
Use a spreadsheet or chart snapshots for the 50-trade proof exercise. The format matters less than the consistency. Every trade gets logged the same way, every time.
Key Takeaways
A clear entry signal requires four defined components: context, trigger, confirmation, and a predefined stop with position size calculated before the trade is placed.
Point | Details |
Four components required | Every trade needs context, trigger, confirmation, and a predefined stop with position size. |
50-trade proof exercise | Log 50 identical-rule trades to calculate win rate, expectancy, and profit factor before trusting a setup. |
Execution discipline | Use OCO orders, reduce size on news days, and never move a stop against the trade. |
Log wins and losses equally | Reviewing failed trades builds the same confidence as reviewing winners; skip neither. |
Big Move Algo enforces clarity | The indicator maps trigger, confirmation, and Fake Trend Detector to the four-component framework on TradingView. |
The habit that separates consistent traders from hopeful ones
Most traders focus on finding better signals. The traders who actually stick around focus on following the signals they already have. That shift in focus is not obvious when you are starting out, and most trading content never addresses it directly.
Here is the behavioral habit worth building: before every trade, take 30 seconds and run the pre-trade checklist out loud. Not in your head. Out loud, or typed into a notes app. The act of verbalizing each step breaks the impulse-entry pattern more reliably than any indicator setting.
When you hesitate at an entry, that hesitation is usually information. Either the setup is genuinely incomplete (one of the four components is missing), or you are experiencing normal pre-trade anxiety that rule-following will resolve. The way to tell the difference: take a screenshot of the chart, write down what you see, and ask yourself which rule is unclear. If you can name the missing component, wait. If all four components are present and you are still hesitating, that is execution anxiety, and the only cure is placing the trade at the correct size and watching what happens.
Steven Hartwell has covered trading systems and behavioral finance for over a decade. His author bio and credential verification are available on the Big Move Algo editorial page.
Big Move Algo gives you a ready-made entry signal framework on TradingView
Retail traders who want the four-component framework built into their charts without coding it from scratch have a direct option: Big Move Algo. The indicator runs on TradingView and labels Long, Short, and Exit signals in real time, with the Fake Trend Detector filtering out low-quality market conditions before a signal appears. That is the confirmation and noise-filter layer handled automatically.

AUTO Mode is the fastest way to start. Install the indicator, run it on your preferred market and timeframe, and follow the 20-trade paper-trading plan before committing full size. MANUAL Mode gives you control over parameters once you understand how the signals behave across your specific setup. The indicator works across crypto, forex, stocks, indices, and commodities, so the same 50-trade proof exercise applies regardless of which market you trade.
The recommended first step: add Big Move Algo to one chart, pick one template from this article that matches your timeframe, and run the AUTO Mode setup guide to configure alerts. Then log every signal for 20 trades before scaling. Visit bigmovealgo.com to review subscription options and get started.
Useful sources
Testing and metrics:
Trading Confidence: How to Trust Your Setups With Real Data — TradersSecondBrain’s 50-trade proof framework, including what to log and how to calculate expectancy.
How to Build Confidence in Your Trading Strategy — Practical steps for building strategy confidence through structured review.
5 Strategies To Build Your Trading Confidence — Capital.com’s guide on treating wins and losses as data and using objective review processes.
Psychology and execution:
Two Types of Confidence Every Trader Must Build — Trade That Swing’s breakdown of analytical vs. execution confidence and how to develop both.
Indicator setup and signal clarity:
Trading Signal Clarity Levels: A Trader’s Complete Guide — Big Move Algo’s guide to signal clarity taxonomy and the Fake Trend Detector.
How to Get Clear Long Short Trading Signals — Walkthrough of how Big Move Algo labels and enforces signal clarity.
The Role of Entry Signals in Trade Planning — How entry signals fit into a complete trade plan and risk framework.
Examples of Actionable Trade Signals for Traders — Real-world signal examples that complement the three templates in this article.
How To Use Automation | Big Move Algo — Product documentation for AUTO and MANUAL modes, alert setup, and integration guidance.
Recommended
Comments