
How to Verify a Trading Signal Before Entering a Trade


Before you click “buy” or “sell,” every signal needs to pass a fast, non-negotiable checklist: confirm the asset, direction, entry zone, stop-loss, take-profit, timeframe, and invalidation level. If any of those seven elements is missing, the trade is a pass, not an entry. Tools like TradingView and Big Move Algo make this faster, but the sequence itself is what keeps you out of bad trades.
A complete trading signal must include all seven elements before it is even worth analyzing further. According to trade verification standards, missing any of these seven elements makes a signal un-evaluable and opens the door to emotional decision-making.
Quick pre-trade filter:
Pass: All 7 elements present, technical confirmation aligns, risk:reward meets your minimum
Watch: 5–6 elements present, one confirmation missing, market context unclear
Ignore: Fewer than 5 elements, no stop-loss, no invalidation level, anonymous source with no track record
Table of Contents
What does a valid trading signal actually require?
A signal is not a tip. It is a structured instruction with enough information to size a position, place a stop, and know exactly when the setup is wrong. Seven elements are the minimum standard, and each one does a specific job.
The seven required elements:
Market/asset: Which instrument, exactly. “Crypto” is not a signal. “BTC/USD on Coinbase” is.
Side: Long or short. No ambiguity.
Entry price/zone: A specific price or a defined range. “Near support” fails. “$42,800–$43,100” passes.
Stop-loss: The price where the thesis is wrong. Without it, you cannot calculate position size.
Take-profit: At least one target. Signals with no exit plan force you to improvise under pressure.
Timeframe: The chart context the signal was built on. A daily signal and a 5-minute signal require completely different position sizes and holding periods.
Invalidation level: The condition, not just the price, that kills the setup. “If price closes above $44,500 on the daily, the trade is off” is an invalidation. “If it goes up” is not.
Good vs. bad signal phrasing:
Element | Reject | Accept |
Entry | “Buy near support” | “Buy $42,800–$43,100” |
Stop | “Below recent lows” | “Stop-loss price” |
Target | “Aim for resistance” | “Take-profit level” |
Invalidation | “If it reverses” | “Invalid on daily close above $44,500” |
Pro Tip: When a signal is missing one element and you think you can “figure it out,” that is confirmation bias starting. If you cannot derive the missing element objectively from price structure alone, the answer is always to pass.
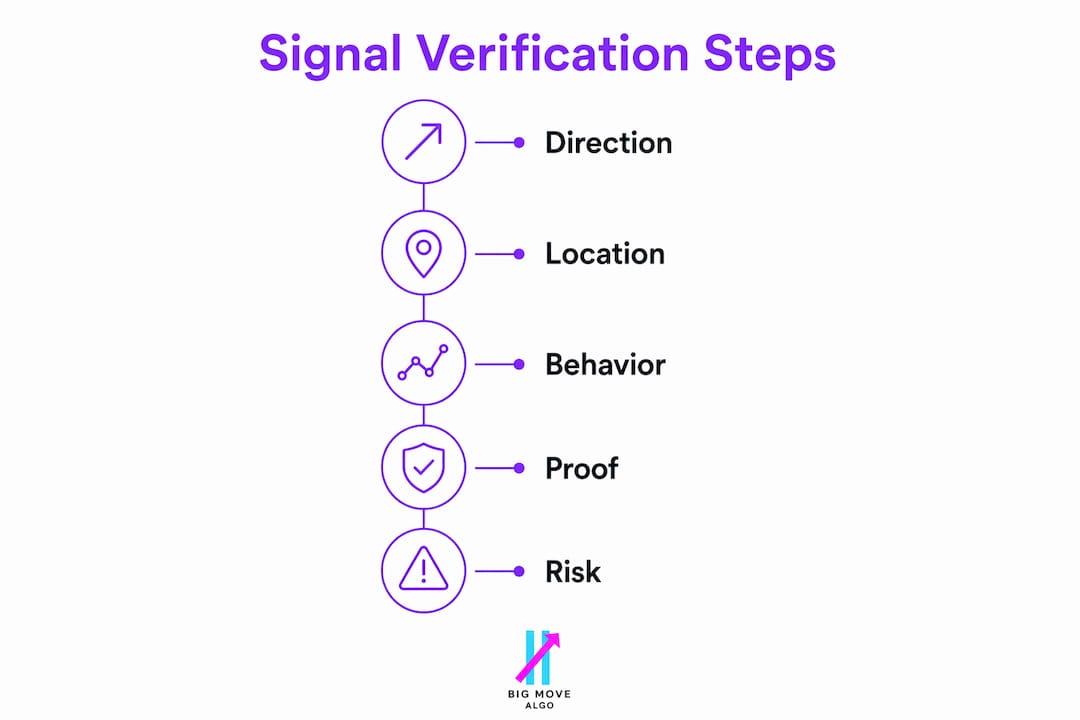
Trade qualification works as a sequential filter: direction, location, behavior, proof, and risk. If any phase fails, disqualify the trade immediately. Rationalization happens when you skip a step and then work backward to justify the entry.
How do you run fast technical confirmations in under three minutes?
Technical confirmation is not about adding more indicators. It is about checking whether independent data sources agree with the signal’s premise. The goal is to spend 60–180 seconds on a structured check, not an hour second-guessing yourself.

Multi-timeframe alignment first. For swing trades, start with the daily or 4-hour chart to establish the dominant trend. The signal’s timeframe should be trading in the same direction as the higher-timeframe bias. For intraday entries, the 15-minute chart sets the bias and the 5-minute chart provides the trigger. A long signal on a 5-minute chart that runs against a clear daily downtrend is a low-probability setup regardless of how clean it looks locally.
Four practical confirmations to run:
Higher-timeframe trend: Is the signal direction consistent with the 1-2 timeframe levels above the entry chart?
Momentum reading: RSI above 50 for longs, below 50 for shorts. MACD histogram crossing in the signal direction adds weight.
Volume confirmation: A breakout or retest with volume significantly above the 20-period average is more reliable than one on thin volume. Volume Profile can show whether price is entering a high-activity or low-activity zone.
Price-action trigger: A clean retest of a broken level, a candlestick close above resistance, or a rejection wick at a key zone. The trigger should be visible and unambiguous.
The critical rule here: use indicators from different categories — trend, momentum, volume, and volatility — rather than stacking tools that measure the same thing. RSI, Stochastic, and Williams %R all measure momentum. Running all three tells you nothing new.
Pro Tip: Multi-indicator confirmation works when the indicators are uncorrelated. Combining a moving average (trend), RSI (momentum), and volume (participation) gives you three genuinely different data points. Combining RSI, Stochastic, and CCI gives you one data point repeated three times.
What risk controls must you confirm before committing capital?
A signal that passes technical checks still fails if the math does not work for your account. Position sizing, stop placement, and risk:reward are not optional extras. They are the mechanism that keeps a losing streak from becoming a blown account.

Position size calculation
The formula is straightforward. Decide your maximum risk per trade as a percentage of equity (most retail traders use 1–2%). Divide that dollar amount by the distance from entry to stop-loss in dollar terms. That gives you your position size.
Example math:
Account Size | Risk Per Trade (1%) | Stop Distance | Position Size |
$10,000 | $100 | $200 (per unit) | 0.5 units |
$10,000 | $100 | $100 (per unit) | 1.0 unit |
$25,000 | $250 | $500 (per unit) | 0.5 units |
$25,000 | $250 | $250 (per unit) | 1.0 unit |
A wider stop does not mean more risk if you reduce size proportionally. The risk is fixed at the account level; the position size adjusts to match.
Risk:reward minimums
A 1:2 risk:reward ratio is the standard floor for most setups. At moderate win rates with 1:2 risk:reward, the strategy can still be profitable. Accepting a lower risk:reward ratio is defensible only when confirmation is unusually strong across multiple timeframes and the setup has a favorable documented win rate.
Expected drawdown
Before entering a series of trades on a new signal, estimate the worst-case drawdown from a losing streak. Losing streaks of multiple consecutive trades are statistically plausible over a typical sample of trades. Depending on risk per trade, this can lead to notable drawdowns. Size your positions accordingly, not optimistically.
How do you verify a signal source’s real reliability?
A signal provider’s claimed win rate is almost never the number you should trade on. The metrics that actually matter are harder to fake and rarely advertised.
Objective metrics to track:
Time-stamped track record: Every signal entry and exit should have a verifiable timestamp. Screenshots without timestamps are worthless for due diligence.
Inclusion of losing trades: Any provider that only shows winners is showing you a curated fiction. A credible track record includes every trade, including the bad ones.
Sample size: Fewer than 30–50 trades is statistically meaningless. A 90% win rate over 10 trades tells you nothing.
Balanced accuracy: Standard accuracy can look impressive on a directionally biased sample. Balanced accuracy and precision correct for that by weighting performance across both long and short signals equally.
Survivorship bias check: Providers who delete channels, rename accounts, or restart track records after drawdowns are hiding the data that matters most.
Red flags that should end the evaluation immediately:
Anonymous operator with no verifiable identity
Deleted or edited signal posts after the fact
Vague setups with no entry, stop, or target
Affiliate links to brokers (incentive conflict)
Pressure to act fast on signals
Balanced accuracy and precision are more informative than a headline win rate, especially when a provider’s signals skew heavily long or short. A provider with 70% accuracy on long-only signals in a bull market may have 30% accuracy in neutral conditions. Balanced accuracy reveals that gap; simple accuracy hides it.
A simple scoring rubric: award one point each for a public time-stamped record, documented losing trades, 50+ trade sample, disclosed methodology, and no broker affiliate conflict. A provider scoring 4–5 is worth forward-testing. Below 3, move on.
You can also check signal accuracy metrics in more depth to understand how precision and balanced accuracy are calculated before you apply them to a provider’s track record.
How do you validate a new signal before risking real money?
Testing is not optional. It is the only way to separate a signal that looks good from one that actually performs under live conditions, with real spreads, real slippage, and real timing delays.
The three-stage validation sequence:
Backtest with realistic costs. Apply the signal rules to historical data. Include the spread, commissions, and a conservative slippage estimate. Count every trade the rules would have triggered, including losers. A backtest that only counts winners is not a backtest. Minimum sample: 30 completed trades across different market conditions. Platforms like QuantGenie let you build and test algorithmic rules without writing code, which removes a common barrier for retail traders.
Forward test on demo for 30–90 days. Paper trading reveals what backtesting misses: late signal delivery, platform execution delays, and the psychological pressure of watching a position move against you. Run a series of live-market signals on a demo account over several weeks to months before drawing conclusions. A thorough demo period is recommended before committing real capital.
Scale in at micro size. After a demo pass, move to the smallest live position your broker allows. Run another 20–30 trades. Compare real fills to demo fills. If slippage is consistently worse than expected, that changes the strategy’s expected value. Only after this stage should you scale toward your normal position size.
Practical timeline:
Initial weeks: Backtest a sufficient number of trades and document results
Subsequent weeks: Forward test via demo signals, tracking performance metrics
Then test micro live sizes to compare with demo
Scale to normal size only if micro-live results align reasonably with demo outcomes.
Track signal performance metrics throughout. Win rate alone is not enough. You need precision, balanced accuracy, and average R:R per trade.
What do you check at the exact moment you place the order?
The signal passed every filter. Now the execution itself needs to match the plan. This is where many traders lose ground they already earned through good analysis.
Execution-time checklist:
Correct instrument and contract: Confirm the ticker, expiration (for futures/options), and exchange. A wrong symbol is a real risk, especially in fast markets.
Order type: Use a limit order when you have a defined entry zone and liquidity is adequate. Use a market order only when the signal requires immediate execution and the spread is tight. For most retail setups, a limit order at the signal’s entry zone is the right call.
Acceptable slippage: Know your maximum tolerable slippage before you place the order. For liquid instruments (major forex pairs, large-cap stocks), a few cents or pips is normal. For thin markets, slippage can eat a significant portion of the expected R:R.
Position size matches the plan: Double-check the lot size or share count before confirming. A misplaced decimal is a common and painful error.
Broker confirmation reconciliation: After the fill, compare the broker’s trade confirmation to your pre-trade plan. Reconcile price, quantity, and timing against what you planned. A fill 0.5% worse than expected on every trade compounds into a material drag on annual returns.
Pro Tip: Log the broker’s actual fill price next to your planned entry price in your trade journal every single time. After 30 trades, you will know your real average slippage per instrument. That number changes how you calculate expected value going forward.
When liquidity is thin or the market is moving fast, a limit order that does not fill is better than a market order that fills at a terrible price. Missing a trade is recoverable. A bad fill on an oversized position is not always.
How Big Move Algo shortens the verification checklist for you
Most of the checklist above takes time because traders have to pull data from multiple sources and synthesize it manually. Big Move Algo is built to compress that process without removing the rigor.
How the tool maps to the checklist:
Signal structure: Every Big Move Algo signal on TradingView includes a direction (Long, Short, or Exit), an entry zone, a stop-loss level, and a take-profit target. That covers four of the seven required elements automatically.
Fake Trend Detector: This built-in filter identifies low-quality or misleading market conditions and suppresses signals when the environment does not support reliable entries. It handles a significant portion of the “market context” check that traders otherwise run manually.
Multi-market coverage: The indicator runs across crypto, forex, stocks, indices, and commodities on TradingView, so the multi-timeframe bias check is available on the same platform where the signal appears.
AUTO vs. Manual mode: AUTO Mode applies preset filters with minimal setup, which suits traders who are still building their verification process. Manual Mode lets experienced traders adjust sensitivity and add their own confirmation layers on top of the base signal.
Practical setup:
When a Long or Short signal appears, check the Fake Trend Detector status first. If it flags the condition as low-quality, treat the signal as a “watch” or “ignore” regardless of how clean the price action looks. If the detector is clear, move to your timeframe alignment check and momentum read. The examples of actionable trade signals in Big Move Algo’s documentation show what a complete signal looks like in practice, which is useful for calibrating what to accept and what to question.
Pro Tip: Use AUTO Mode during your demo forward-test phase. It removes setup variables and lets you evaluate the signal logic itself. Once you move to live micro-size trading, switch to Manual Mode and start layering in your own confirmation criteria. That progression mirrors the validation timeline in Section 6.
Key Takeaways
Every signal you act on should have passed a structured verification sequence, not just looked good in the moment. The checklist is the process, and the process is what separates consistent traders from reactive ones.
Point | Details |
Seven elements are mandatory | A signal missing any of: asset, direction, entry, stop, target, timeframe, or invalidation level is a pass, not an entry. |
Confirmation requires uncorrelated tools | Mix trend, momentum, volume, and volatility indicators; stacking same-category tools adds no new information. |
Size from risk, not conviction | Calculate position size from your fixed risk per trade and stop distance; never size from how confident you feel. |
Test before scaling | Run at least 30 backtested trades, then 20–30 demo signals, then micro live size before committing full capital. |
Big Move Algo automates key checks | The Fake Trend Detector and structured Long/Short/Exit signals cover signal structure and market-quality filtering automatically. |
Why discipline beats hunting for the perfect signal
There is a version of signal verification that traders use as a rationalization engine rather than a filter. They run through the checklist, find one item that does not quite fit, quietly ignore it, and enter anyway because the trade “feels right.” That is not verification. That is confirmation bias with extra steps.
The checklist works only when you treat it as a disqualification sequence. The moment a signal fails a filter, the trade is off. Not “probably off.” Not “off unless the next candle looks good.” Off. The discipline to walk away from a setup that is 80% there is what separates traders who survive drawdowns from those who do not.
Confirmation bias shows up in two predictable ways. The first is cherry-picking: you remember the signals that worked and forget the ones that failed the same criteria you are now ignoring. The one-sentence counter is to log every signal you evaluate, not just the ones you take. The second is anchoring: you see a signal, form a directional opinion, and then interpret every subsequent data point as confirmation. The counter is to run the checklist before forming an opinion, not after.
The stop-loss and position size exist precisely because the checklist cannot remove all uncertainty. A well-verified signal still loses sometimes. The process controls the size of those losses and keeps them from compounding into something unrecoverable. That is the actual job of verification: not to find perfect trades, but to make sure the imperfect ones stay manageable.
Big Move Algo gives you a faster path to verified signals
Retail traders who want structured, pre-filtered signals without building a multi-indicator stack from scratch have a direct route: Big Move Algo delivers Long, Short, and Exit signals on TradingView with entry zones, stop-loss levels, and take-profit targets already built in. The Fake Trend Detector filters out low-quality market conditions before a signal even reaches you, which cuts the manual context check down to seconds.

The recommended starting point is a demo run using AUTO Mode. Forward-test 20–30 signals on a practice account, log your results against the balanced accuracy and precision metrics covered in this guide, and compare your demo fills to the signal levels. After a clean demo period, move to micro live size with Manual Mode to layer in your own confirmation criteria. The full validation timeline from this guide applies directly.
Get started at Big Move Algo and run your first verified signal on a practice account before committing real capital.
Useful sources and further reading
The sources below back the methods in this guide and are worth consulting directly when you want to go deeper on a specific topic.
How to Verify Trading Alerts: Credibility and Execution — Best starting point for the 7-element checklist and red-flag evaluation of signal providers. Covers survivorship bias and time-stamped record requirements.
Validate Buy and Sell Stock Signals Before Trading — Practical 10-step validation template and the 30–90 day forward-test timeline. Use this when building your demo testing protocol.
Confirmation (Investopedia) — The authoritative reference for mixing indicator categories (trend, momentum, volatility, volume) to avoid correlated false confirmation.
Multi-Indicator Signal Confirmation: LedgerMind — Detailed breakdown of how uncorrelated multi-indicator systems reduce false signals. Useful when designing your technical confirmation stack.
How to Measure the Quality of a Trading Signal (Macrosynergy) — The primary source for balanced accuracy and precision metrics. Read this before you evaluate any signal provider’s performance claims.
Confluence in Trading: Meta Trading Club — Explains the sequential qualification framework (direction, location, behavior, proof, risk) and why missing a step should always result in a pass.
Confirmation in Trading: Quantopia — Clarifies the difference between a broker trade confirmation and a pre-entry signal confirmation. Relevant for the execution reconciliation step.
What Is a Trading Signal? Big Move Algo — Overview of signal structure and Big Move Algo’s feature set, including the Fake Trend Detector and AUTO/Manual modes.
Recommended
Comments