
What Is Signal Accuracy in Trading? A Clear Guide


Signal accuracy in trading is defined as the percentage of trading signals that correctly forecast profitable trade opportunities. Understanding what is signal accuracy in trading separates traders who make consistent, data-driven decisions from those who chase every alert and wonder why their account shrinks. Accuracy alone does not tell the full story. Execution factors like latency, market regime alignment, and signal-to-noise ratio all shape how a signal performs in live conditions. This guide covers the metrics, benchmarks, and validation frameworks traders at every level need to evaluate signal quality honestly.
What is signal accuracy in trading, and how is it measured?
Signal accuracy is the ratio of correct trade predictions to total signals generated. If a system produces 100 signals and 65 lead to profitable outcomes, the accuracy rate is 65%. That number sounds simple, but it hides critical nuance that separates a useful signal from a dangerous one.
Professionals use three core metrics to evaluate trading signal effectiveness: accuracy, precision, and recall. Accuracy measures overall correctness across all signals. Precision measures how many of the predicted profitable signals actually were profitable. Recall measures how many real profitable opportunities the system actually captured.

These distinctions matter most in markets where genuinely profitable setups are rare. A system that fires signals constantly may show a decent accuracy rate while missing the few high-quality setups that drive real returns. Precision and recall together reveal whether a system is selective and correct or just lucky with volume.
Statistical significance adds another layer. A 65% win rate across only 20 trades may carry a p-value of 0.2, meaning there is a 20% chance those results are due to luck rather than a real edge. That is not a reliable signal. Traders need sample sizes large enough to confirm that results reflect genuine predictive power, not random variance.
Pro Tip: Before trusting any signal service, ask for a minimum of 100 verified trades. Anything below that threshold lacks the statistical weight to confirm a real edge.
What realistic accuracy levels should traders expect?
Independently verified forex signal accuracy ranges realistically between 60% and 80% over time. That benchmark gives traders a clear filter for evaluating any signal provider.
The accuracy spectrum breaks down into four practical bands:
Accuracy Range | What It Means |
Below 50% | Unreliable. Worse than a coin flip. |
50%–60% | Inconsistent. Marginal edge, easily erased by costs. |
60%–80% | Reliable. Consistent with professional-grade systems. |
Above 80% | Rare. Requires independent verification before trusting. |
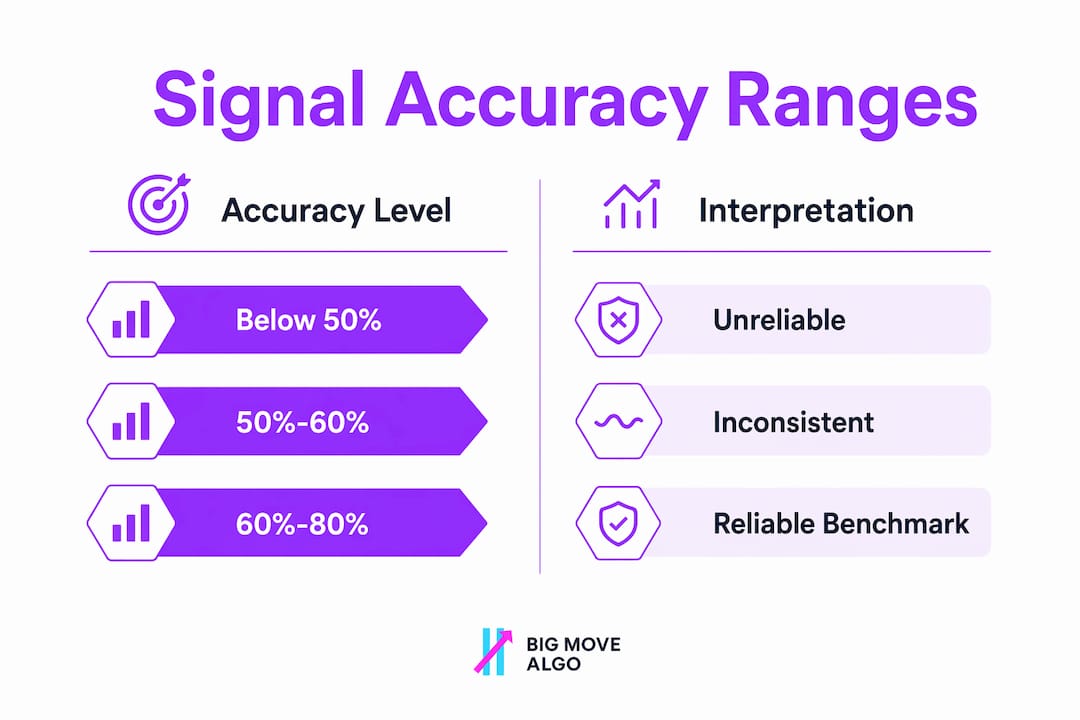
Claims above 80% are rare and often unreliable without third-party auditing. Many signal services report accuracy using cherry-picked periods or exclude losing trades from their published results. That practice is called selective reporting, and it is widespread in the retail trading industry.
Independent verification matters more than any marketing claim. A signal service that publishes a live, audited track record over 12 or more months carries far more credibility than one showing a backtest or a screenshot of winning trades. Long-term consistency across different market conditions is the real test of signal quality.
Pro Tip: Ask any signal provider whether their results come from live trading or backtesting. Backtested results frequently overstate accuracy because they are built on historical data the system was designed around.
What factors impact trading signal accuracy in real-world execution?
Signal accuracy in a backtest and signal accuracy in live trading are two different numbers. Several real-world factors reduce effective accuracy the moment a signal leaves the screen and hits the market.
Latency. Latency is the delay between when a signal fires and when a trade executes. Even a few seconds of delay in a fast-moving market can turn a profitable entry into a losing one. Latency, market regime deviation, spread quality, and signal agreement all feed into a composite Signal Quality Score (SQS) that determines whether conditions are actually ready for a trade.
Market regime alignment. A trend-following signal performs well in a trending market and poorly in a choppy, sideways one. Signals must align with current market trends and volatility regimes. Misaligned signals are more likely to be noise than genuine opportunities.
Signal-to-noise ratio. Generating more than 5–10 signals per week across a universe of 500 stocks suggests a signal quality problem. High signal volume often indicates overfitting or noise rather than real opportunity. Quality signals are selective by nature.
Volume confirmation. Breakouts that occur on average or below-average volume tend to fail. Volume acts as a lie detector for price moves. A signal supported by strong participation is far more reliable than one that fires on thin trading activity.
Slippage and fill rates. Many backtested signals cannot be fully executed live due to slippage or liquidity gaps. A signal that shows a 75% accuracy rate in backtesting may deliver 62% in live conditions once real fill rates are factored in.
Pro Tip: Always test a signal system in a live paper-trading environment for at least 30 days before committing real capital. Real-world fill rates reveal what backtests cannot.
How can traders validate signal accuracy with a scorecard?
A single metric never tells the full story. A signal quality scorecard combining the Sharpe ratio, drawdown consistency, and fill rate gives traders a structured way to judge true signal quality across multiple failure modes.
Each metric targets a different weakness:
Sharpe ratio measures return relative to risk. A high Sharpe ratio means the system earns consistent returns without wild swings. A low Sharpe ratio signals that returns come with excessive volatility.
Drawdown consistency tracks how deep and how long losing streaks run. A system with a 70% accuracy rate but a 40% maximum drawdown can still wipe out an account before the wins arrive.
Fill rate measures how many signals actually execute at the intended price. Low fill rates mean the theoretical accuracy never translates into real profits.
Composite scoring guides decisions that gut feel cannot. A single good or bad trade outcome is noise. Traders who abandon a system after three losing trades, or stay loyal after three winners, are reacting to randomness rather than evidence.
Rolling window monitoring adds another layer of protection. Composite scores should be updated frequently using fresh data to respond to volatile or regime-changing market environments. A system that scored well six months ago may have degraded as market conditions shifted. Checking the scorecard over a rolling 30-day or 90-day window catches that drift early.
The goal is objective validation. Marketing claims and gut feel are the two most common reasons traders choose poor signals. A structured scorecard removes both from the equation.
How does signal accuracy translate into better trading outcomes?
High signal accuracy improves outcomes only when it connects directly to risk management and position sizing. A validated signal with a 70% accuracy rate gives a trader the confidence to size positions appropriately. A signal with unknown or unverified accuracy forces conservative sizing that limits upside even on winning trades.
Fewer, higher-confidence signals lead to better capital preservation. High accuracy does not guarantee higher profits when large, infrequent losses offset the wins. Traders who take every signal regardless of quality dilute their edge. Traders who wait for high-confidence setups protect capital on the trades that do not work.
Risk-reward ratios work alongside accuracy to determine long-term profitability. A system with 55% accuracy and a 2:1 reward-to-risk ratio outperforms a system with 70% accuracy and a 1:1 ratio over time. Accuracy and risk-reward are partners, not substitutes. Understanding how buy and sell signals are calculated helps traders see both sides of that equation clearly.
Market conditions also shift what accuracy means in practice. A signal that performs at 72% in a trending market may drop to 55% in a range-bound environment. Traders who adjust their expectations and position sizes based on current conditions outperform those who apply the same rules regardless of context.
Key Takeaways
Signal accuracy in trading is only valuable when measured across multiple metrics, verified over large sample sizes, and applied within a disciplined risk management framework.
Point | Details |
Accuracy range benchmark | Reliable signals fall in the 60%–80% range; claims above 80% require independent verification. |
Use three core metrics | Accuracy, precision, and recall together reveal signal quality better than win rate alone. |
Real-world factors reduce accuracy | Latency, market regime, and fill rates all lower live accuracy below backtested results. |
Scorecard validation works | Combining Sharpe ratio, drawdown consistency, and fill rate catches failure modes single metrics miss. |
Accuracy needs risk management | High accuracy without proper position sizing and risk-reward ratios does not protect capital. |
The uncomfortable truth about signal accuracy I’ve learned over time
Most traders fixate on accuracy percentage as if it were a score on a test. Higher is better, full stop. That belief causes more account damage than almost any other misconception in retail trading.
I have reviewed systems with 80%+ win rates that lost money consistently. The math was simple once you looked past the headline number. The losses on the 20% of losing trades were three to four times the size of the wins. The accuracy looked great. The account did not.
The psychological challenge is real. Waiting for fewer, higher-quality signals feels wrong when you are watching the market move and your system stays quiet. That silence is the feature, not a flaw. Signals that remove trading guesswork are designed to keep you out of low-probability setups, not just get you into high-probability ones.
Emerging tools that build market regime awareness directly into signal scoring are changing how serious traders evaluate quality. The shift from static accuracy rates to dynamic, context-aware scoring is the most meaningful development in signal validation I have seen in years. Traders who adopt that framework stop chasing numbers and start managing real edge.
— Steven Hartwell
Big Move Algo: signals built around verified accuracy
Signal accuracy means nothing without a system designed to maintain it across real market conditions.

Big Move Algo is a TradingView indicator that delivers clear Long, Short, and Exit signals across crypto, forex, stocks, indices, and commodities. The built-in Fake Trend Detector filters out low-quality market conditions before a signal fires, which keeps the signal-to-noise ratio tight. Big Move Guard technology adds another layer of quality assurance, designed to avoid the curve-fitting that inflates backtested accuracy and collapses in live trading. Traders can start with AUTO Mode for instant setup or use Manual Mode for deeper customization. Big Move Algo reports up to a 92% win rate, with results built for live market conditions, not just historical data.
FAQ
What is a good signal accuracy rate in trading?
A reliable signal accuracy rate falls between 60% and 80%, based on independently verified data. Claims above 80% are rare and require third-party auditing before they can be trusted.
Why doesn’t high accuracy always mean higher profits?
High accuracy does not guarantee profits when losing trades are significantly larger than winning ones. Risk-reward ratio must be evaluated alongside accuracy to judge true profitability.
How many trades do I need to validate a signal’s accuracy?
A sample of at least 100 trades is the minimum needed for statistical reliability. Fewer trades carry too much variance to confirm whether results reflect a real edge or random luck.
What metrics should I use beyond win rate?
Precision, recall, Sharpe ratio, drawdown consistency, and fill rate each reveal different failure modes. A composite signal scorecard combining these metrics gives a far more complete picture than win rate alone.
How does market regime affect signal accuracy?
Signals built for trending markets lose accuracy in choppy, sideways conditions. Aligning signal use with the current market regime is one of the most direct ways to protect effective accuracy in live trading.
Recommended
Comments